


 Share via Email
This analysis uses data on CMHC insured homeowner transactional mortgages and looks at the employment industry of the borrowers who have deferred their mortgage payments.
Highlight of findings
- Borrowers working in the Services, Construction and Retail Sales industries had an above-average share in deferred mortgages; those working in the Government, Education and Health sectors had a below-average share. This is observed at the national level, as well as for the provinces.
- The occurrences of deferrals positively correlate with the change in the unemployment rate in these industries.
- The reduction in deferred mortgages distributed evenly across the borrower’s employment industry. As at September 30, 2020, 7.2% of the CMHC insured homeowner transactional mortgages remained in deferral.
We first focus on the period up to June 2020, when the unemployment rate had peaked and the bulk of deferrals had occurred. We then provide the most recent information on the deferrals that is available at the time of this report.
Borrowers working in Services, Construction and Retail Sales had above-average deferrals
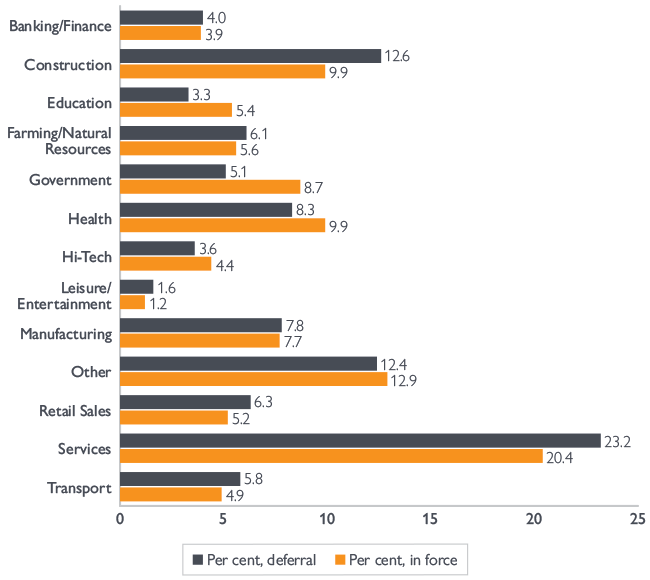
Among the CMHC insured homeowner transactional mortgages that were outstanding as at March 31, 2020, 17.1% had exercised the payment deferral options by the end of May. The share of deferred mortgages by the borrower’s employment industry is largely consistent with the distribution of the outstanding loans.1 However, borrowers working in some industries were less resilient than others, as shown in Figure 1.
- Borrowers working in the Services (2.8), Construction (2.7) and Retail Sales (1.1) industries had an above-average share in deferred mortgages. Their share in deferred mortgages is higher than the share in outstanding mortgages.
- Borrowers working in the Government (-3.6), Education (-2.1) and Health (-1.6) industries had a below-average share in deferred mortgages. Their share in deferred mortgages is lower than the share in outstanding mortgages.
The numbers in brackets are an employment industry’s share in deferred mortgages minus its share in all in-force mortgages.2
Figure 1. Borrower’s employment industry, as at May 31, 2020
| Industry | Per cent, deferral | Per cent, in force |
|---|---|---|
| Banking/Finance | 4.0 | 3.9 |
| Construction | 12.6 | 9.9 |
| Education | 3.3 | 5.4 |
| Farming/Natural Resources | 6.1 | 5.6 |
| Government | 5.1 | 8.7 |
| Health | 8.3 | 9.9 |
| Hi-Tech | 3.6 | 4.4 |
| Leisure/Entertainment | 1.6 | 1.2 |
| Manufacturing | 7.8 | 7.7 |
| Other | 12.4 | 12.9 |
| Retail Sales | 6.3 | 5.2 |
| Services | 23.2 | 20.4 |
| Transport | 5.8 | 4.9 |
Source: CMHC
Unemployment rates in Services, Construction and Retail Sales increased the most
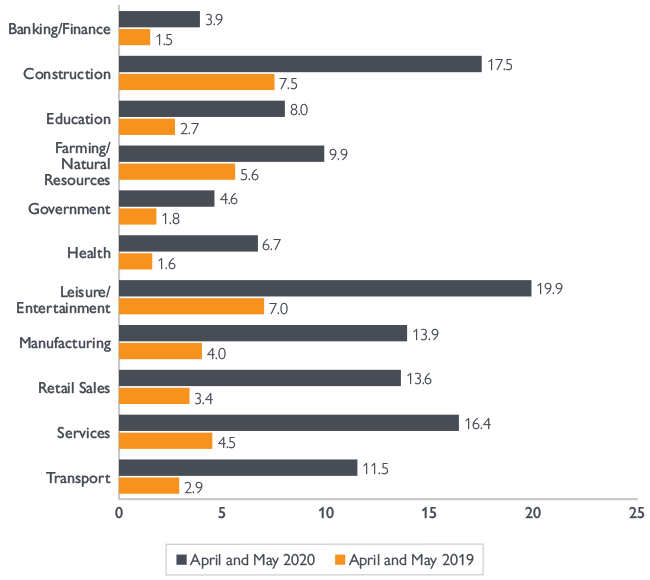
The deferral pattern is consistent with the changes in unemployment in these industry sectors.3 Figure 2 compares the average unemployment rate in April and May 2020 to the same months in 2019.4 The Services, Retail Sales and Construction sectors were among the ones with the largest increases in the unemployment rate. The unemployment rates in these sectors were, respectively, 11.9%, 10.2% and 10.0% higher in 2020 than in 2019.
The Leisure/Entertainment industry also experienced a 12.9% increase in the unemployment rate during the same period. This did not produce a large volume of deferrals, as borrowers in this sector account for only 1.2% of the in-force mortgages.
Figure 2. Average unemployment rate, per cent
| Industry | April & May 2019 | April & May 2020 |
|---|---|---|
| Banking/Finance | 1.5 | 3.9 |
| Construction | 7.5 | 17.5 |
| Education | 2.7 | 8.0 |
| Farming/Natural Resources | 5.6 | 9.9 |
| Government | 1.8 | 4.6 |
| Health | 1.6 | 6.7 |
| Leisure/Entertainment | 7.0 | 19.9 |
| Manufacturing | 4.0 | 13.9 |
| Retail Sales | 3.4 | 13.6 |
| Services | 4.5 | 16.4 |
| Transport | 2.9 | 11.5 |
Source: CMHC calculations using Statistics Canada Table 14-10-0022-01
Services, Construction and Retail Sales industries had the largest increases in unemployment
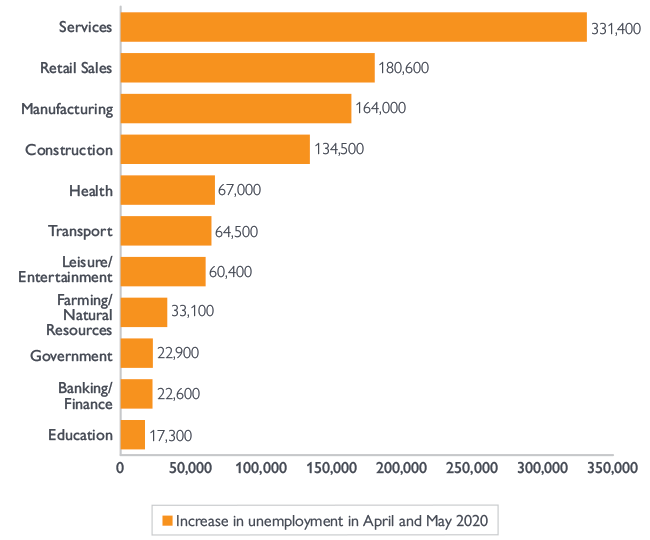
Figure 3 shows the increase in the number of persons unemployed from March to May 2020. The Services (331,400), Retail Sales (180,600) and Construction (134,500) sectors reported the largest increases in the number of unemployed persons.5 These sectors represented a higher than average share in deferrals seen for the CMHC insured transactional homeowner mortgages.
Figure 3. Increase in unemployment from March to May 2020
| Industry | Number of persons |
|---|---|
| Services | 331,400 |
| Retail Sales | 180,600 |
| Manufacturing | 164,000 |
| Construction | 134,500 |
| Health | 67,000 |
| Transport | 64,500 |
| Leisure/Entertainment | 60,400 |
| Farming/Natural Resources | 33,100 |
| Government | 22,900 |
| Banking/Finance | 22,600 |
| Education | 17,300 |
Source: CMHC calculations using Statistics Canada Table 14-10-0022-01
Alberta’s share in deferred mortgages is greater than its share in outstanding loans
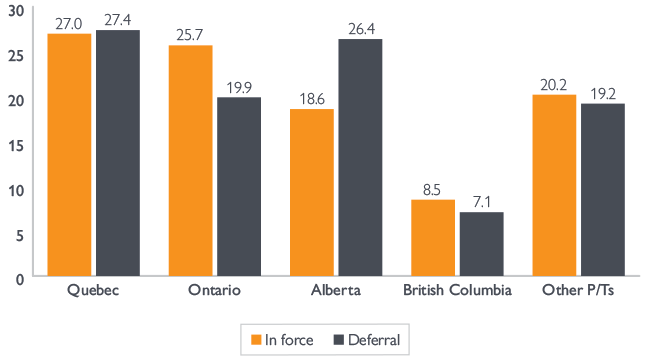
By the end of June, 17.9% of the outstanding homeowner transactional mortgages insured by CMHC had exercised the payment deferral option. Quebec, Alberta, Ontario and British Columbia accounted for 79.8% of the outstanding mortgages and 80.8% of all the deferrals. Figure 4 compares the provinces’ share in the deferred mortgages and their share in the outstanding loans.
- Alberta’s share in the deferred mortgages was greater than its share of the outstanding loans.
- Ontario and British Columbia’s share in the deferred mortgages was smaller than their share of the outstanding loans.
Figure 4. Share in deferred and in-force mortgages by province and territory (%), as at June 30, 2020
| Province | Deferral | In force |
|---|---|---|
| Quebec | 27.4% | 27.0% |
| Ontario | 19.9% | 25.7% |
| Alberta | 26.4% | 18.6% |
| British Columbia | 7.1% | 8.5% |
| Other P/Ts | 19.2% | 20.2% |
Source: CMHC
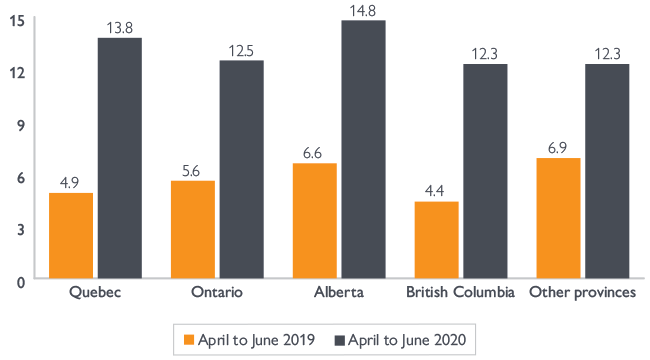
Alberta has the highest unemployment rate among all provinces during April and June 2020
During the three-month period from April to June 2020, the four provinces that reported the most mortgage deferrals (Quebec, Alberta, Ontario and British Columbia) had the largest increase in unemployment rate from the same period in 2019. Figure 5 shows that the four provinces had lower unemployment rates than the other provinces in general between April and June 2019, but higher unemployment rates in 2020.
Figure 5. Average unemployment rate, per cent
| Province | April to June 2019 | April to June 2020 |
|---|---|---|
| Quebec | 4.9 | 13.8 |
| Ontario | 5.6 | 12.5 |
| Alberta | 6.6 | 14.8 |
| British Columbia | 4.4 | 12.3 |
| Other provinces | 6.9 | 12.3 |
Source: CMHC calculation using Statistics Canada Table 14-10-0022-01
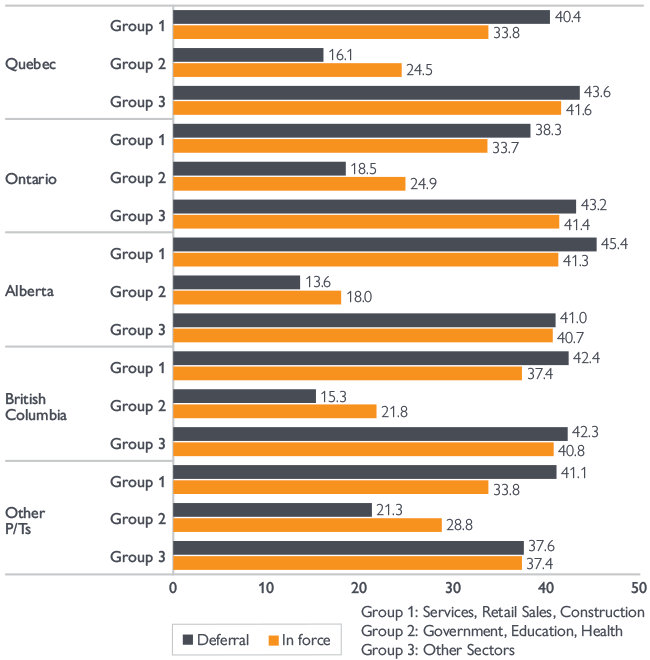
Borrowers working in Services, Construction and Retail Sales had above-average deferrals
At the national level, Canadian borrowers working in the Services, Retail Sales and Construction sectors had an above-average share in deferrals observed for the CMHC insured transactional homeowner mortgages, and those working in the Government, Education and Health sectors had a below-average share.
We observed this pattern at the provincial level as well. In Figure 6, Group 1’s (the Services, Retail Sales and Construction sectors) share in the deferred mortgages is greater than its share in the outstanding loans for the provinces. Group 2 (the Government, Education and Health sectors) has a lower-than-average share in the deferred mortgages. Group 3’s (all other sectors) share in the deferred mortgages is similar to its share in all outstanding loans.
Figure 6. Borrower’s employment industry by province and territory (%), as at June 30, 2020
| Province / Industry | Deferral | In force |
|---|---|---|
| Quebec — Services, Retail Sales, Construction | 40.40% | 33.80% |
| Quebec — Government, Education, Health | 16.10% | 24.50% |
| Quebec — Other sectors | 43.60% | 41.60% |
| Ontario — Services, Retail Sales, Construction | 38.30% | 33.70% |
| Ontario — Government, Education, Health | 18.50% | 24.90% |
| Ontario — Other sectors | 43.20% | 41.40% |
| Alberta — Services, Retail Sales, Construction | 45.40% | 41.30% |
| Alberta — Government, Education, Health | 13.60% | 18.00% |
| Alberta — Other sectors | 41.00% | 40.70% |
| British Columbia — Services, Retail Sales, Construction | 42.40% | 37.40% |
| British Columbia — Government, Education, Health | 15.30% | 21.80% |
| British Columbia — Other sectors | 42.30% | 40.80% |
| Other P/Ts — Services, Retail Sales, Construction | 41.10% | 33.80% |
| Other P/Ts — Government, Education, Health | 21.30% | 28.80% |
| Other P/Ts — Other sectors | 37.60% | 37.40% |
Source: CMHC
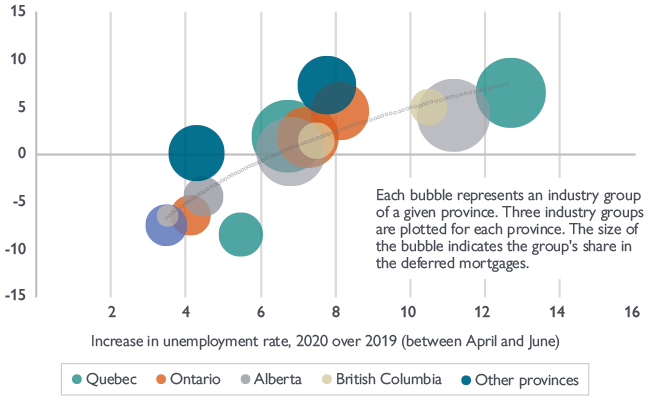
Higher-than-average deferral correlates with larger increase in the unemployment rate
The occurrences of payment deferrals positively correlates with the change in the unemployment rate. Figure 7 illustrates this relationship. The x-axis is the increase in the unemployment rate between April and June 2020 above the same period in 2019. The y-axis is the difference between the share in deferred and outstanding mortgages.
A positive number indicates an above-average share in deferred mortgages. Each bubble represents an industry group (Group 1, 2 or 3) of a given province. The size of the bubble indicates the group’s share in all deferred mortgages. The dotted trend line shows that a higher occurrence of mortgage deferral is associated with a higher increase in the unemployment rate.
Figure 7. Mortgage deferrals and the change in unemployment rate, as at June 30, 2020
| Geography / Industry | A | B | C |
|---|---|---|---|
| Quebec — Services, Retail Sales, Construction | 12.7 | 6.5 | 11.1 |
| Quebec — Government, Education, Health | 5.5 | -8.5 | 4.4 |
| Quebec — Other Sectors | 6.7 | 1.9 | 12.0 |
| Ontario — Services, Retail Sales, Construction | 8.1 | 4.6 | 7.6 |
| Ontario — Government, Education, Health | 4.1 | -6.4 | 3.7 |
| Ontario — Other Sectors | 7.3 | 1.8 | 8.6 |
| Alberta — Services, Retail Sales, Construction | 11.2 | 4.1 | 12.0 |
| Alberta — Government, Education, Health | 4.5 | -4.4 | 3.6 |
| Alberta — Other Sectors | 6.8 | 0.3 | 10.9 |
| British Columbia — Services, Retail Sales, Construction | 10.5 | 5.0 | 3.0 |
| British Columbia — Government, Education, Health | 3.5 | -6.5 | 1.1 |
| British Columbia — Other Sectors | 7.5 | 1.5 | 3.0 |
| Other provinces — Services, Retail Sales, Construction | 7.8 | 7.3 | 7.8 |
| Other provinces — Government, Education, Health | 3.5 | -7.5 | 3.9 |
| Other provinces — Other Sectors | 4.3 | 0.1 | 7.1 |
A: increase in unemployment rate, 2020 over 2019 (in April, May and June)
B: share in deferred mortgages minus share in outstanding mortgages (share within province)
C: share in deferred mortgages (province-industry over all provinces)
All numbers are in percentage. The deferral numbers in this table (B and C) exclude the territories to correspond to the unemployment rate statistics.
Source: CMHC and CMHC calculation using Statistics Canada Table 14-10-0022-01
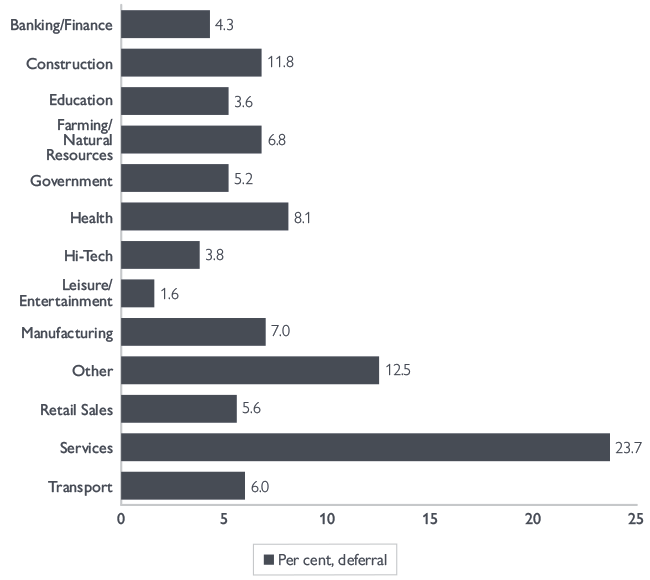
Active deferrals by borrower employment industry, as at September 30, 2020
As at September 30, 2020, 7.2% of the CMHC insured homeowner transactional mortgages were still active in deferral. The reduction in deferred mortgages distributed evenly across the borrower’s employment industry. The share of deferrals by industry remained largely unchanged compared to the earlier month. Figure 8 shows each industry’s share in the deferrals calculated as the number of deferred mortgages in each industry over the total deferred mortgages. The shares are similar to those reported in Figure 1.
Figure 8. Share of deferred mortgage by borrower’s employment industry, as at September 30, 2020
| Industry | Share in September | Share in May |
|---|---|---|
| Leisure/Entertainment | 1.6% | 1.6% |
| Education | 3.6% | 3.3% |
| Hi-Tech | 3.8% | 3.6% |
| Banking/Finance | 4.3% | 4.0% |
| Government | 5.2% | 5.1% |
| Retail Sales | 5.6% | 6.3% |
| Transport | 6.0% | 5.8% |
| Farming/Natural Resources | 6.8% | 6.1% |
| Manufacturing | 7.0% | 7.8% |
| Health | 8.1% | 8.3% |
| Construction | 11.8% | 12.6% |
| Other | 12.5% | 12.4% |
| Services | 23.7% | 23.2% |
Source: CMHC
