Skip to content
CMHC Home Canada Mortgage
and Housing Corporation
  • Sign In or Register
  • Français
  • MENU
MENU
× Français
  • Home
  • Professionals
    • Project funding and mortgage financing
      • Funding programs
        • Affordable Housing Fund
        • Affordable Housing Innovation Fund
        • Apartment Construction Loan Program
        • Canada Greener Affordable Housing
        • Community (social) housing
        • Federal Lands Initiative
        • Funding for Indigenous housing
        • Housing Supply Challenge
        • Innovation and research
        • National Housing Strategy Project Profiles
        • Rapid Housing Initiative
      • Mortgage Loan Insurance Products
        • Homeowner and Small Rental Mortgage Loan Insurance
          • CMHC Purchase
          • CMHC Improvement
          • CMHC Income Property
          • CMHC Refinance
          • CMHC Newcomers
          • CMHC Self-Employed
          • CMHC Portability
          • Eco Products for Lenders
        • Multi-Unit and Rental Housing
          • MLI Select
        • Default, claims and properties for sale
        • Underwriting centre
        • emili
        • NHA approved lenders
        • Calculating GDS / TDS
        • How to recognize and report mortgage fraud
        • Contact mortgage loan insurance
        • Insured Mortgage Purchase Program (IMPP)
      • Securitization
        • NHA Mortgage Backed Securities
        • Canada Mortgage Bonds
        • Canadian registered covered bonds
        • Blockchain in the housing industry
    • Housing markets, data and research
      • CMHC Reports Calendar
      • Housing markets
        • Housing market reports
        • Mortgage market and consumer reports
        • Fall 2024 Rental Market Report
      • Housing research
        • Consultations
          • Prohibition on the Purchase of Residential Property by Non-Canadians Act
            • Prohibition on the Purchase of Residential Property by Non-Canadians Act – Frequently asked questions
        • Housing research reports
        • Housing surveys
          • Mortgage consumer surveys
        • Research awards and scholarships
        • Understanding core housing need
        • Collaborative Housing Research Network
      • Housing data
        • Data tables
          • Household characteristics data
          • Housing market data
          • Mortgage and debt data
          • Rental market data
        • Housing market information portal
        • Residential Mortgage Industry Data Dashboard
        • CMHC licence agreement for the use of data
        • Housing Knowledge Centre
    • Industry innovation and leadership
      • Housing innovation
      • Our Partners
        • Partnerships
        • Federal, Provincial and Territorial Forum on Housing
      • Industry collaboration
        • Expert Community on Housing (ECoH)
      • Industry expertise
        • Affordable housing
        • Indigenous housing
        • Senior housing
        • Accessible and adaptable housing
        • Developing sustainable housing
        • Resources for mortgage professionals
        • CMHC newsletters
    • Events and speakers
      • Conferences
        • 2024 National Housing Conference
          • About
          • National Housing Conference - Agenda
          • Location
          • InnoZone
          • Details for participants
      • Speakers’ bureau
        • Kevin Hughes
  • Consumers
    • Buying a home
      • Homebuying calculators
        • Mortgage calculator
        • Affordability calculator
        • Debt service calculator
      • Buying guides
        • Homebuying step by step
        • CMHC's condominium buyer's guide
      • Mortgage loan insurance for consumers
        • What is CMHC mortgage loan insurance?
        • Do I qualify for mortgage loan insurance?
        • CMHC mortgage loan insurance costs
        • CMHC's Eco Products
          • CMHC’s Eco Improvement
          • CMHC Eco Plus
        • CMHC — home renovation financing options
        • FAQs — mortgage loan insurance
      • Incentives for homebuyers
      • Newcomers
      • The First-Time Home Buyer Incentive
    • Owning a home
      • Manage your mortgage
        • Mortgage fraud
        • Mortgage planning tips
        • Plan and manage your mortgage
        • Your credit report
        • Your home value
      • Aging in place
        • Housing options for Seniors
        • Housing and finance tips
        • Mortgage financing options for people 55+
        • Preventing fraud and financial abuse
    • Renting a home
      • I want to rent
        • Things to consider before renting
        • Types of housing for rent in Canada
        • Finding or advertising a rental property
        • Visiting the rental property
        • Lease and rental agreements
        • Signing the lease
        • Credit checks and bad credit
        • Rental payments and deposits
        • Roommates and pets
      • I am renting
        • Moving day
        • Landlord/Tenant responsibilities
        • Inspections
        • Maintenance and repairs
        • Complaints and evictions
        • Rent increases
        • When you can't pay rent
        • Renewing or terminating the lease
        • Moving out
      • One-Time Top-Up to the Canada Housing Benefit
      • COVID‑19: eviction bans and suspensions to support renters
  • About CMHC
    • CMHC’s goals, values and commitment to housing
    • Discover Life at CMHC
    • Management and governance
      • Speakers’ bureau
      • CMHC's Annual Public Meeting
      • CMHC’s board of directors and committees
      • Our management committee
      • Pension governance
        • Pension overview
        • Key roles and responsibilities
        • Annual reports
    • Corporate reporting
      • CMHC’s 2023 Annual Report
      • Program evaluation
      • Quarterly financial reports
      • Joint auditors special examination report to CMHC board 2018
      • CMHC’s Insured Mortgage Deferral
      • Corporate Plan Summary
      • Transparency
        • Access to information and privacy protection
        • Accessibility at CMHC
        • Accessibility feedback process
        • Briefing materials
        • Procurement
          • Vendor Diversity Program
        • Travel, hospitality and conference expenditures
    • Contact us
      • Contact mortgage loan insurance
      • Regional offices
      • Granville lsland
      • Indigenous and the North Housing Solutions
      • National office
      • Holiday service hours
  • Media Newsroom
  • National Housing Strategy
    • What is the strategy?
      • About the initiatives
      • How to apply
      • Help and resources
      • Priority areas for action
      • The National Housing Strategy Glossary of Common Terms
      • The Strategy in Action
    • Federal/Provincial/Territorial housing agreements
    • Other funding and financing opportunities
  • The Housing Observer
  • Canada’s Housing Podcast
  • Careers
  • Housing Knowledge Centre
 
  • Home
  • The Housing Observer
  • 2020 Rental Market Report
  • Save
  • Share

2020 Rental Market Report

January 28,  2021

Save Icon

SAVE TO MY FOLDER

2020 Rental Market Report

SAVE
Close this Window   |   Manage my Folder
Save Icon

SAVE TO MY FOLDER

2020 Rental Market Report

Done Done!
Close this Window   |   Manage my Folder
Share icon

Share via

  • Facebook
  • LinkedIn
  • Mail
  • print
  • CopyLink

SuccessCopyLinkVersionLink copied

Share icon

Share via

  • Facebook
  • LinkedIn
  • Mail
  • print
  • CopyLink

SuccessCopyLinkVersionLink copied

share icon

Mail-blue Share via Email

Did You Know?

You can include an email signature?

Register | Sign In

×
Google Captcha Loader
share icon

Mail-blue Share via Email

Done Done!
Close this window

2020 was a year like no other. We saw increases in rent and arrears across the country. Indicators showed that tenants were reluctant to move and that there is a challenge in finding affordable rental housing. The Rental Market Report and associated data tables for 2020 is now available. Below are the national highlights as well as highlights on the major centres.

Vacancy rate and rent both increased in Canada in 2020

Overall CMAs Vacancy Rate

2.0%
2019

3.2%
2020

+1.2%

Overall CMAs Rental Rate

$1,113
2019

$1,165
2020

+3.6%

(Av. 2-bedroom apartment)

Rent arrears increased nationally due to COVID-19

Rent arrears (national table 5.0), shows the negative impact of the COVID-19 pandemic on renter households and the rental market in Canada. This is new for the 2020 survey. For those apartment structures with rents in arrears:

  • 32.5% reported their arrears rate as similar to 2019
  • 58.3% reported a higher arrears rate
  • 9.2% said arrears were lower compared to 2019

Among Canada’s CMAs, 6.11% or 116,929 apartment units were in arrears out of a total universe of 1,912,290 units. This represented approximately $150 million in total rent in arrears or 0.59% of total expected rent. The survey suggests that 0.59% or 6.11% units in arrears were primarily apartment units with lower rents. In terms of Canada’s largest CMAs, Toronto recorded the highest arrears rate, with 10.68% of units (34,858) in arrears and 0.92% of rent (approximately $55 million) in arrears. Among all provinces, Ontario posted the highest arrears rate in Canada, with 10.18% of apartment units and 0.81% of rent (approximately $87 million) in arrears as of October 2020.

Tenants were more reluctant to move within Canada in 2020

At the national level, 14.0% of rental dwellings welcomed a new household between the last two rental market surveys. This decrease from 2019’s turnover rate of 17.3% is the largest variation since this data was first compiled in 2016. Among Canadian CMAs, none saw an increase in the turnover rate in 2020, with declines recorded in 65% of the centres surveyed. This highly similar result across the country likely reflects the reluctance of households to search for and visit new apartments or move during the COVID-19 pandemic.

Availability of affordable purpose-built rental stock a challenge for many Canadians

Table 3.1.8 provide more information on the affordability of the purposed-built rental stock. The table separates the number of units having the range of rents that would be affordable1 to each quintile of the renter income distribution in each CMA.

The renter income distribution is derived from the Census by, first, sorting renter households from lowest to highest income. Then, dividing them into five equal 20% portions (quintiles). For example, the first quintile in Toronto CMA comprises households who earn less than $25,000 annually. In order to be described as affordable, their monthly rent should account for less than 30% of their gross income. This means they would need to find an apartment renting for less than $625 a month. By comparison, in Calgary CMA, where incomes are higher, the characteristics of the first quintile of the income distribution are different. It is comprised of households who earn less than $36,000 a year. This means that a monthly rent of $900 would be deemed affordable for this group. By dividing the income distribution into quintiles, we can compare across Canadian centres accounting for the differing economic conditions.

We gain a better understanding of market imbalances among Canadian cities. We can compare the number of units in the private rental market that have rents corresponding to the different income quintiles. In a perfectly balanced market, an equal number of rental units would be affordable in each quintile. If fewer units are affordable for households in lower income quintiles, they will need to:

  • spend a greater share of their income on housing
  • seek non-market housing options, or
  • obtain subsidies in order to cover their accommodation costs

Figure 1 (Lorenz Curve) below illustrates the distribution of renter household incomes and the corresponding proportion of the rental universe that would be affordable to them.

The results show that the lower quintiles of the income distribution CMAs face significant challenges in finding affordable market rental accommodation. Just 0.2% of the rental universe in Vancouver CMA and Toronto CMA are affordable to renter households in the first quintile. Contrast Montréal, where 15% of the rental universe is affordable to households in the first income quintile. However, Montréal CMA still falls short of the share of apartments that would allow all renters in this quintile to find an affordable unit. Across cities, access to rental improves greatly by the third quintile of the income distribution. For example, a cumulative 80.9% of the rental universe would be affordable and available to the first 60% of renter households in Vancouver CMA (Figure 1).

The results also show that vacancy rates are generally lower for the most affordable units (due to higher competition). These units tend to be smaller (predominantly bachelor or 1-bedroom units). Both of these realities raise additional challenges for lower income households, particularly for families requiring more space.

This new data has revealed important differences in market rental affordability within and between major cities in Canada. It is our objective that this data can inform evidence-based discussions on this topic. This will help us move toward an environment where every Canadian has a home that meets their needs and that they can afford.

Figure 1: Cumulative portion of market purpose-built rental universe that is affordable to each quintile of the renter household income distribution, select CMAs, 2020

 
Figure 1: Cumulative portion of market purpose-built rental universe that is affordable to each quintile of the renter household income distribution, select CMAs, 2020
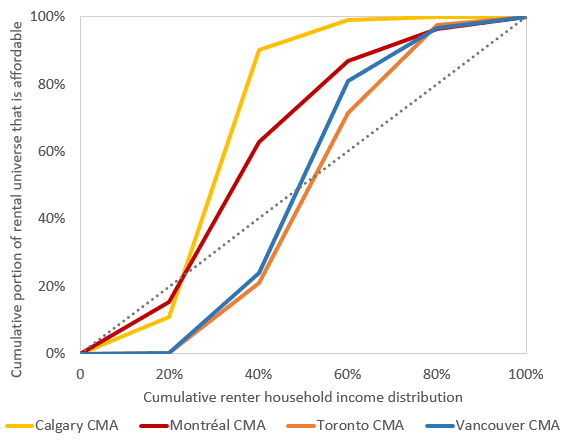
Cumulative renter household income distribution Vancouver (%) Toronto (%) Montréal (%) Calgary (%)
20% 0.2 0.2 15.3 10.7
40% 23.9 20.9 62.8 90.3
60% 80.9 71.4 86.8 99
80% 96.8 97.5 96.5 100
100% 100 100 100 100

Source: CMHC (Rental Market Survey); Statistics Canada Census 2016; CMHC calculations.

1 Rent ranges are calculated at the affordability threshold of 30% of monthly income for each quintile.

Additional key highlights on the major centres are presented below with new data and notable changes. Further details on Canada’s rental market can be viewed in the full report and associated data tables for 2020.

Vancouver

Vacancy rate: increased to 2.6%

Average rent: $1,508 up by 2.0%

Highlights:

  • Purpose-built rental apartment vacancy rate increased from 1.1% in 2019 to 2.6% in 2020 due to higher supply and lower demand. Newer structures in central areas drove the increase in the vacancy rate, while vacancy rates decreased in suburban markets.
  • Average apartment rent increase slowed to 2.0%; however, prospective tenants face higher rents than longer-term tenants. The average asking rent for vacant units is 21.4% higher than the average rent paid for occupied units.
  • Overall rental market loosened somewhat in 2020. New rental affordability data show that significant imbalances remain, posing challenges for lower income renter households.
  • Number of condominium apartments in long-term rental increased by 10.2% (7,137 units). Investor-owners increased their involvement in the long-term condominium rental market.

Toronto

Vacancy rate: increased to 3.4%

Average rent: $1,523 up by 4.7%

Highlights:

  • Lower rental demand combined with supply growth increased primary and secondary vacancy rates in 2020.
  • Despite higher vacancy rates, rents were resilient in the primary rental market.
  • While vacancy rates rose across the Greater Toronto Area (GTA), they were highest in Toronto’s downtown core.
  • Economic fallout of the COVID-19 pandemic helped ease the average primary vacancy rate in the GTA to reach a 14-year high. Job losses occurred in the service and hospitality sectors that tend to pay lower wages and employ younger workers. These worker are key typical renter households.
  • Toronto Census Metropolitan Area (CMA) recorded the highest share of rent arrears (0.92%) in Canada. They also recorded about 11% of all units reporting arrears in rent payments. The pandemic disproportionately affected lower paid workers in the hospitality and service sectors. These numbers are reflective of a larger share of population in Toronto relative to the rest of Canada. Toronto has a greater concentration of workers in these industries.

Montréal

Vacancy rate: increased to 2.7%

Average rent: $891 up by 4.2%

Highlights:

  • The vacancy rate increased in 2020, reaching 2.7%. However, it remained stable in the suburbs, at 1.2%, while it doubled on the Island of Montréal, reaching 3.2%.
  • The market eased on the Island of Montréal. This was in part due to a substantial increase in vacancy rates in medium-sized and large rental towers in the city’s central areas.
  • Average rent in Greater Montréal increased by 4.2% in 2020, the largest increase since 2003.
  • The following contributed to the vacancy rate increases:
    • decrease in net international migration
    • absence of in-person university courses because of COVID-19
    • return to the long-term rental market of tourist-oriented short-term rental units
  • Lack of students on the market also affected the availability of apartments with three or more bedrooms (for shared accommodation). This market segment saw the largest increase in the vacancy rate this year.
  • About 10,600 new rental apartments were added to the rental stock since 2019, a record for the last 30 years. 80% of these new units were located in the suburbs. Still, demand in that area was strong enough to keep the vacancy rate unchanged.

Victoria

Vacancy rate: increased to 2.2%

Average rent: $1,275 up by 3.3%

Highlights:

  • The vacancy rate increased to 2.2% in purpose-built rental apartments as the COVID-19 pandemic slowed down demand growth.
  • Average apartment rent increased by 3.3%, faster than inflation and the provincially allowable rent increase. This results in a $356 premium of asking rent for vacant units compared to rent for occupied units.
  • Localized rental construction and completions led to little rental universe expansion in most of the municipalities.
  • Rental affordability remains a challenge for low-income households looking for suitable and family-friendly unit sizes.

Edmonton

Vacancy rate: increased to 7.2%

Average rent: $1,153 up by 0.8%

Highlights:

  • Purpose-built rental apartment vacancy rate increased to 7.2% due to lower demand and higher supply.
  • Despite an increase in the overall vacancy rate, there was no significant change in average rents.
  • Market conditions continue to be tight in the condominium apartment segment, resulting in a decline in the vacancy rate.

Calgary

Vacancy rate: increased to 6.6%

Average rent: $1,195 unchanged

Highlights:

  • Apartment vacancy rate rose to 6.6%, a level last seen in 2016.
  • Average rent rose slightly to $1,195, as property owners used non-price measures to compete for tenants.
  • Rental supply in both primary and secondary rental markets grew by 2.5% (1,650 units), led by a higher increase in primary rental units.

Saskatoon

Vacancy rate: unchanged at 5.9%

Average rent: $1,078 up by 2.0%

Highlights:

  • Overall vacancy rate for purpose-built rental apartments was 5.9% in 2020, unchanged from a year ago.
  • Same-sample rents increased for a third consecutive year, but at a modest pace.
  • Conditions in the condominium rental market remained tight.

Regina

Vacancy rate: unchanged at 7.5%

Average rent: $1,061 up by 0.5%

Highlights:

  • Apartment vacancy rate was 7.5% in October 2020, statistically unchanged from October 2019.
  • Demand outpaced new additions to supply in the townhome and rental condominium apartment segments. This drove vacancy rates down to 2.7% and 5.0%, respectively.
  • After two years of declines, same-sample rents for apartments saw a modest increase in 2020.

Winnipeg

Vacancy rate: increased to 3.8%

Average rent: $1,107 up by 3.0%

Highlights:

  • The apartment vacancy rate increased to 3.8% as supply increased and demand for rental units slowed.
  • The average apartment rent increased 3.0% over the past year as weaker rental demand limited rent growth compared to previous years.
  • While rental demand remains high for affordable units, new rental supply tends to have higher average rents.

Hamilton

Vacancy rate: unchanged at 3.5%

Average rent: $1,207 up by 5.4%

Highlights:

  • Overall vacancy rate was unchanged as rental demand and supply were both similar to last year.
  • A greater number of existing tenants remained in their units this year, offsetting weaker inflows of new renters.
  • More tenants stayed in their rental units. Factors include higher homeownership costs and government measures that addressed either the spread of COVID-19 or the economic fallout it produced.
  • Lower international migration, fewer student renters and weaker employment conditions contributed to weaker inflows of new renters.
  • Rent growth far exceeded the Ontario Rent Increase Guideline of 2.2%.

Sudbury

Vacancy rate: unchanged at 2.5%

Average rent: $1,207 up by 2.7%

Highlights:

  • Average vacancy rate for purpose-built rental apartments was 2.5% in 2020, unchanged from a year ago.
  • Demand decreased by a similar magnitude to supply resulting in stable market conditions.
  • Fixed sample average rent for an apartment grew slightly higher than the Ontario Rent Review Guideline of 2.2% set for 2020.

Kitchener – Cambridge – Waterloo

Vacancy rate: unchanged at 2.1%

Average rent: $1,221 up by 4.0%

Highlights:

  • Increase in average rent for a sample of units in structures that are common to the RMS in 2019 and 2020 was 4.0%. This is above the provincial guidelines of 2.2% for 2020 and the eighth consecutive year where the rent increase was above the provincial guidelines.
  • A larger portion of the local economy were employed in sectors that fared relatively well through 2020, considering the pandemic. This allowed jobs and incomes to be sustained, propping up housing demand.
  • Rental options are severely limited for renter households at the low end of the income distribution.

Belleville

Vacancy rate: unchanged at 3.0%

Average rent: $1,126 up by 5.5%

Highlights:

  • Average vacancy rate for purpose-built rental apartments was 3.0% in 2020, unchanged from a year ago.
  • Strong increase in demand for rental apartments was offset by a large increase in supply, resulting in a stable vacancy rate.
  • Average fixed-sample rent for all bedroom types increased by 5.5%.

Peterborough

Vacancy rate: increased to 2.6%

Average rent: $1,124 up by 4.9%

Highlights:

  • Average vacancy rate for purpose-built rental apartments increased to 2.6% in 2020 from 2.1% in 2019.
  • About 14% of the purpose-built stock would be affordable to households with income in the range of $25K-36K.This is based on the standard affordability criteria.
  • Fixed-sample average rent increased by 4.9%, higher than 2.6% in 2019.

Windsor

Vacancy rate: increased to 3.6%

Average rent: $937 up by 8.4%

Highlights:

  • Average vacancy rate for purpose-built rental apartments was 3.6% in 2020, up from 2.9% the previous year.
  • Rental demand decreased, pushing the vacancy rate slightly higher.
  • Fixed sample average rents for two-bedroom apartments grew by 8.7%, well above the provincial guideline of 2.2% set for 2020.

St. Catharines – Niagara

Vacancy rate: unchanged at 2.7%

Average rent: $1,075, up by 5.6%

Highlights:

  • Primary apartment vacancy rate in 2020 remained steady at 2.7%.
  • Purpose-built rental apartment supply grew modestly by 0.5% in 2020.
  • The matched-sample average two-bedroom apartment rent increase, at 6.1% in 2020, was the strongest in nearly 30 years.

London

Vacancy rate: increased to 3.4%

Average rent: $1,119 up by 7.0%

Highlights:

  • Purpose-built rental apartment vacancy rate increased to 3.4%.
  • New supply was met with muted rental demand.
  • Average fixed sample rent increase for two-bedroom apartments was 6.8%.

Kingston

Vacancy rate: increased to 3.2%

Average rent: $1,282 up by 3.1%

Highlights:

  • Average vacancy rate for purpose-built rental apartments increased to 3.2% in 2020 from 1.9% in 2019.
  • Highest vacancy rate was recorded in the downtown core, the area that commands some of the higher rents.
  • Fixed-sample average rent for two-bedroom units increased by 2.5% down from 7.4% in 2019.

Ottawa

Vacancy rate: increased to 3.9%

Average rent: $1,358 up by 4.5%

Highlights:

  • Overall vacancy rate for purpose-built rental apartments rose from 1.8% to 3.9% on weaker demand and rising supply relative to October 2019.
  • Average fixed-sample rent for two-bedroom apartments increased at a robust 5.2%, but lower than 2019’s 8.0%.
  • Rent arears were among the lowest in the country supported by the relative stability of the labour market.

Gatineau

Vacancy rate: unchanged at 1.6%

Average rent: $906 up by 2.4%

Highlights:

  • While the supply of rental housing increased significantly, several factors contributed to equally strong growth in demand. Part of the demand included the increase in the number of households coming from Ottawa.
  • Average rent for two-bedroom apartments increased by 2.2%, a slowdown compared to the previous year (4.2%). This ends three years of increases in the estimated change in the average rent.
  • More than one in three condominium units were available for rent, up from 2019. This increase may reflect growing investor appetite for this market.

Québec

Vacancy rate: unchanged at 2.7%

Average rent: $874 up by 2.7%

Highlights:

  • Overall vacancy rate was 2.7% in October 2020; stable when compared to 2.4% in October 2019.
  • Market conditions eased in some of Québec’s central sectors, while it tightened in several suburban sectors and on the South Shore.
  • Renters continue to have relatively more choice in the upper rent ranges.
  • The vacancy rate for rental condominiums increased to 3.2% in 2020 (1.4% in 2019).

Halifax

Vacancy rate: increased to 1.9%

Average rent: $1,170 up by 4.1%

Highlights:

  • Increased vacancy rate contributed to a drop in international immigration and changes to university program delivery.
  • Average rent increased by 4.1% despite the easing of pressure on the rental market.
  • Peninsula South structures built in the last two years had a vacancy rate of 2.7% and an average rent of $1,954.

Was this page relevant to your needs?

Thank you for your feedback!

How Can We Help?

Suggest an Improvement

Report a Bug

How Can We Help?

Suggest an Improvement

Please share your suggestion.

Google Captcha Loader

How Can We Help?

Report a Bug

Please describe the problem.

Google Captcha Loader

Thank you. Your feedback has been submitted.

Discover related content using the tags below:

  • Rental Housing
  • Housing Supply
  • Research
Date Published: January 28, 2021

By Topic

  • Professionals
    • Project funding and mortgage financing
    • Housing markets data and research
    • Industry innovation and leadership
    • Events and speakers
  • Consumers
    • Home buying
    • Owning a home
    • Renting a home

About Us

  • CMHC's Story
  • Management and Governance
  • Our Partners
  • Corporate Reporting
  • Contact Us
  • Careers

More

  • CMHC Newsletters
  • CMHC Library
  • Housing Observer
  • Media Newsroom
  • CMHC and Accessible Housing
  • CMHC on Twitter
  • CMHC on LinkedIn
  • CMHC on Facebook
  • CMHC on Instagram
  • CMHC on YouTube
Privacy Policy    |    Terms and Conditions    |    Transparency    |    Accessibility Plan    |    Accessibility Feedback     Canada Mortgage and Housing Corporation (CMHC) ©2025 
Canada
loader icon