
 FR
FR
 Sign In



 Done!
Done!





 Link copied
 Share via Email
- Terminology and Calculations for Mortgage-Backed Securities
- Appendix 1: Notation
- Appendix 2: Old Annualizing Formula
- Appendix 3: Appropriateness of PPR and LQR
- Appendix 4: Penalty Interest Payments in PCBOND
- Calculating MBS Cash Flows
- Calculating Prepayment Rates
- Miscellaneous Formulas
- Price Calculations
- Risk Measures
- Total Prepayment (UPP)
- Tranche Payments
Monthly prepayment and liquidation rates
The standard MBS valuation model uses a constant monthly partial prepayment rate, p, and a constant monthly liquidation rate, q, to generate the amortization schedule for a hypothetical mortgage used to represent the underlying mortgage pool. Typically, p and q will be obtained from prepayment forecasts. In the example that follows, we adopt a naive forecasting strategy to illustrate how p and q can be calculated from historical data.
Table 1 shows 12 months of scheduled and unscheduled cash flows for a hypothetical NHA mortgage-backed security. Each month, a liquidation rate, qk, can be calculated using the following formula:
 [1]
[1]
where
lqrk=liquidation cashflow in month k
SRPK=remaining principal after scheduled principal payment
After removing liquidated mortgages from the pool, a partial prepayment rate, pk, can be calculated on those mortgages that remain:
 [2]
[2]
where
pprk=prepayment cashflow in month k
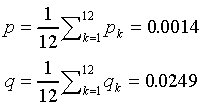
The historical monthly rates of liquidation and partial prepayment are displayed in the columns on the right of Table 1 (the total monthly prepayment rate, uk, displayed in the rightmost column, is discussed in a later section). For the purposes of this example, it is assumed that the constants p and q equal their historical averages over this 12 month period. Thus,
| Principal Balance Bk | Scheduled Principal Sk | Interest Ik | Scheduled Remaining Principal SRPk | Partial Cash Flow pprk |
lqrk | pk % | qk % | uk % |
| 35,023,627 | 53,089 | 279,376 | 34,970,538 | 83,625 | 882,045 | 0.25 | 2.52 | 2.76 |
| 34,004,868 | 54,703 | 271,262 | 33,950,165 | 61,443 | 752,714 | 0.19% | 2.22% | 2.40% |
| 33,136,008 | 49,842 | 264,342 | 33,086,166 | 35,877 | 1,026,762 | 0.11% | 3.10% | 3.21% |
| 32,023,527 | 47,189 | 255,481 | 31,976,338 | 14,335 | 1,215,956 | 0.05% | 3.80% | 3.85% |
| 30,746,047 | 46,162 | 245,306 | 30,699,885 | 12,703 | 1,680,656 | 0.04% | 5.47% | 5.52% |
| 29,006,526 | 44,812 | 231,452 | 28,961,714 | 15,624 | 1,249,260 | 0.06% | 4.31% | 4.37% |
| 27,696,830 | 43,582 | 221,020 | 27,653,248 | 24,460 | 1,096,247 | 0.09% | 3.96% | 4.05% |
| 26,532,541 | 42,483 | 211,747 | 26,490,058 | 21,644 | 347,319 | 0.08% | 1.31% | 1.39% |
| 26,121,094 | 42,706 | 208,470 | 26,078,389 | 21,844 | 199,955 | 0.08% | 0.77% | 0.85% |
| 25,856,590 | 43,159 | 206,363 | 25,813,430 | 24,388 | 59,834 | 0.09% | 0.23% | 0.33% |
| 25,729,209 | 42,904 | 205,349 | 25,686,304 | 84,292 | 338,739 | 0.33% | 1.32% | 1.65% |
| 25,263,274 | 41,640 | 201,638 | 25,221,634 | 86,503 | 210,743 | 0.35% | 0.84% | 1.18% |
| 24,924,387 | ||||||||
| Totals: | 486,738 | 9,060,230 | ||||||
| Averages: | 0.14 | 2.49 | 2.63 |
Annualized prepayment and liquidation rates
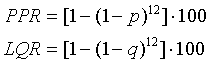
The terms CPR and SMM have been replaced by the terms Partial Prepayment Rate, denoted PPR, and Liquidation Rate, denoted LQR. Both are expressed as lifetime constants on an annualized basis. They are calculated from monthly constants as follows:
 [3]
[3]
where
PPR=annualized constant partial prepayment rate
LQR=annualized constant liquidation rate
p=constant lifetime partial prepayment rate expressed on a monthly basis
q=constant lifetime liquidation rate expressed on a monthly basis
This method of annualizing the monthly prepayment rates produces numbers that reflect the actual prepayment experience over the year. Continuing the example from the previous section, we obtain the following annual figures:

The above figures are very similar to the actual percentage reductions in principal due to partial prepayments and liquidations. For example, the actual percentage reduction due to liquidations can be calculated as follows:
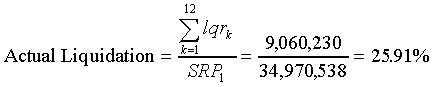
This is close to the LQR value of 26.10%.
In contrast to the above, the old method of annualizing p and q produces annual prepayment figures that are less representative of actual experience. For example,
 [4]
[4]
For small values, the difference between the old and new formulas is not significant. However, the discrepancy increases dramatically as the level of p or q increases.
It should be noted that the discrepancy between the old and new annualizing formulas does not affect the validity of prices calculated under the old formulas. The true inputs to the MBS amortization schedule are the monthly values p and q. The purpose of the new formulas for PPR and LQR is merely to generate annualized prepayment rates that more accurately reflect the principal which would be prepaid if constant monthly numbers p and q were applied for a year.
Appendix 3 provides further discussion of the annualized figures PPR and LQR.