


 Share via Email
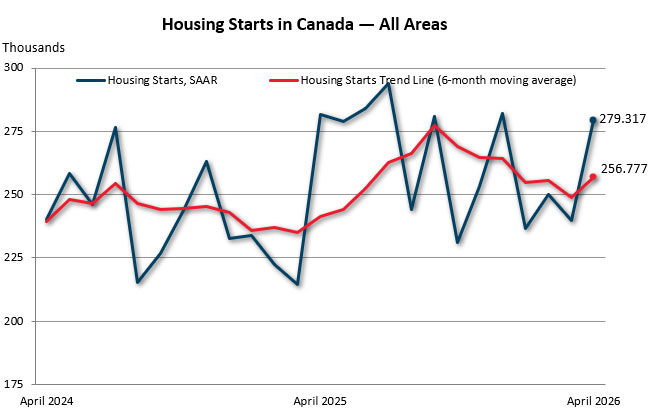
The six-month trend in housing starts was higher in April, with an increase of 3.2% to 256,777 units, according to Canada Mortgage and Housing Corporation (CMHC). The trend measure is a six-month moving average of the seasonally adjusted annual rate (SAAR) of total housing starts for all areas in Canada.
Actual housing starts were down 1% year-over-year in centres with a population of 10,000 or greater, with 21,805 units recorded in April, compared to 21,938 units in April 2025. The year-to-date total was 71,011 units, up 6% from the same period in 2025, driven by higher starts in British Columbia and Ontario.
The total monthly SAAR of housing starts for all areas in Canada increased 17% in April (279,317 units) compared to March (239,747 units).
New to this release, CMHC is publishing building permit data and additional data from the Starts and Completions Survey (SCS). This includes approved units awaiting housing start, as well as the under-construction inventory and the number of units completed. These indicators show a complete view of the residential construction pipeline and are available for centres with a population of 50,000 or more.
Quotes:
“While the six‑month trend in housing starts rose slightly in April, it follows several consecutive months of decline, underscoring the uneven nature of current construction activity, and month-to-month volatility. Building permit data provides additional context for this pattern, pointing to a construction pipeline that remains subdued, in line with CMHC’s Housing Market Outlook,” said Kevin Hughes, Deputy Chief Economist at CMHC.
“Building permits provide an early signal of future residential construction activity, while housing starts capture construction that has begun and offer the best indication of future housing supply. Together, these measures show how development intentions translate into real construction activity, providing a more complete picture of the residential construction market’s trajectory,” said Mathieu Laberge, CMHC’s Chief Economist and Senior Vice-President of Housing Insights. “This is why CMHC is proactively releasing building permits data alongside Starts and Completions Survey data.”
Key facts:
- The rural starts monthly SAAR estimate was 13,694 units.
- Among Canada’s three biggest CMAs, Toronto posted a 34% year-over-year increase in actual housing starts this month driven by higher multi-unit. Montréal starts increased 21% due to higher multi-unit starts. Vancouver recorded a 30% decrease due to lower multi-unit and single-detached starts.
- Read more about why housing starts matter on CMHC’s Housing Observer.
- Monthly Housing Starts and Other Construction Data are accessible in English and French on our website and the CMHC Housing Market Information Portal.
- Housing starts data is available on the eleventh business day each month. We will release the May housing starts data on June 15 at 8:15 AM ET.
- CMHC uses the trend measure as a complement to the monthly SAAR of housing starts to account for considerable swings in monthly estimates and to obtain a clearer picture of upcoming new housing supply. In some situations, analyzing only SAAR data can be misleading, as the multi-unit segment largely drives the market and can vary significantly from one month to the next.
- Read about CMHC's definitions and methodology to better understand the foundations of the Starts and Completions and Market Absorption surveys.
Housing starts facilitate the analysis of monthly, quarterly, and year-over-year activity in the new home market. The data CMHC collects as part of the Starts and Completions and Market Absorption surveys helps us obtain a clearer picture of upcoming new housing supply and is used as part of our various housing reports.
Canada Mortgage and Housing Corporation (CMHC) is a federal Crown corporation and a backbone institution of Canada’s housing system. For over 80 years, CMHC has supported the functioning of housing markets across the country through housing finance solutions — including mortgage loan insurance and securitization — while providing trusted, unbiased data, research and market intelligence to inform policy and decision making. Through its national presence, deep expertise in housing economics and finance, and a system-wide perspective, CMHC helps foster a more stable, well-functioning housing market that supports households, communities and the broader economy.
Follow us on X, YouTube, LinkedIn, Facebook and Instagram.
Related Links:
- Housing starts for March 2026
- Canada’s construction pulse: Permits lead, starts confirm
- Beyond Toronto and Vancouver: Affordability challenges spread across Canadian cities
- Spring 2026 Housing Supply Report
- CMHC’s 2026 Housing Market Outlook
Information on this release:
To request an interview with a CMHC economist, contact:
Media Relations, CMHC
media@cmhc-schl.gc.ca
| Approved Units* Awaiting Housing Start | Under Construction (Units) |
Completions (Units) |
|||||||
|---|---|---|---|---|---|---|---|---|---|
| Province/Centre | Mar. 2026 | Apr. 2026 | % | Mar. 2026 | Apr. 2026 | % | Mar. 2026 | Apr. 2026 | % |
| N.L. | 541 | 413 | -23.7 | 775 | 851 | 9.8 | 65 | 119 | 83.1 |
| P.E.I. | 317 | 294 | -7.3 | 822 | 879 | 6.9 | 31 | 37 | 19.4 |
| N.S. | 3,683 | 3,858 | 4.8 | 13,613 | 13,694 | 0.6 | 395 | 157 | -60.3 |
| N.B. | 1,356 | 1,378 | 1.6 | 6,088 | 5,877 | -3.5 | 361 | 472 | 30.7 |
| Atlantic | 5,897 | 5,943 | 0.8 | 21,298 | 21,301 | 0 | 852 | 785 | -7.9 |
| Que. | 37,076 | 34,533 | -6.9 | 57,337 | 58,963 | 2.8 | 2,883 | 2,764 | -4.1 |
| Ont. | 33,592 | 29,408 | -12.5 | 146,956 | 149,423 | 1.7 | 4,115 | 4,028 | -2.1 |
| Man. | 4,261 | 4,248 | -0.3 | 8,586 | 9,161 | 6.7 | 347 | 195 | -43.8 |
| Sask. | 2,185 | 2,068 | -5.4 | 5,776 | 5,823 | 0.8 | 194 | 549 | 183 |
| Alta. | 23,862 | 24,139 | 1.2 | 43,663 | 43,156 | -1.2 | 3,784 | 3,535 | -6.6 |
| Prairies | 30,308 | 30,455 | 0.5 | 58,025 | 58,140 | 0.2 | 4,325 | 4,279 | -1.1 |
| B.C. | 41,966 | 41,985 | 0 | 82,306 | 83,364 | 1.3 | 3,236 | 3,401 | 5.1 |
| Canada 50,000+ | 148,839 | 142,324 | -4.4 | 365,922 | 371,191 | 1.4 | 15,411 | 15,257 | -1 |
*Units with approved building permits (excluding conversions) that have not yet begun construction and are not yet counted as housing starts. These units, where no construction activity has yet been observed through CMHC’s Starts and Completions Survey (SCS), may be indicative of future housing starts.
## not calculable / extreme value
Source: CMHC Starts and Completions Survey (SCS)
© 2026 Canada Mortgage and Housing Corporation
| Approved Units* Awaiting Housing Start | Under Construction (Units) |
Completions (Units) |
|||||||
|---|---|---|---|---|---|---|---|---|---|
| Province/Centre | Mar. 2026 | Apr. 2026 | % | Mar. 2026 | Apr. 2026 | % | Mar. 2026 | Apr. 2026 | % |
| Abbotsford-Mission | 2,185 | 2,373 | 8.6 | 2,759 | 2,766 | 0.3 | 28 | 186 | ## |
| Barrie | 525 | 644 | 22.7 | 2,060 | 2,030 | -1.5 | 348 | 52 | -85.1 |
| Belleville – Quinte West | 144 | 147 | 2.1 | 828 | 819 | -1.1 | 9 | 17 | 88.9 |
| Brantford | 433 | 410 | -5.3 | 1,803 | 1,858 | 3.1 | 20 | 44 | 120 |
| Calgary | 18,652 | 18,779 | 0.7 | 24,938 | 24,095 | -3.4 | 2,606 | 2,097 | -19.5 |
| Chilliwack | 456 | 150 | -67.1 | 1,022 | 1,209 | 18.3 | 6 | 137 | ## |
| Drummondville | 523 | 292 | -44.2 | 878 | 1,032 | 17.5 | 19 | 89 | ## |
| Edmonton | 4,766 | 4,838 | 1.5 | 16,568 | 16,924 | 2.1 | 993 | 1,362 | 37.2 |
| Fredericton | 270 | 287 | 6.3 | 1,698 | 1,440 | -15.2 | 36 | 266 | ## |
| Greater/Grand Sudbury | 50 | 49 | -2 | 610 | 572 | -6.2 | 38 | 50 | 31.6 |
| Guelph | 120 | 111 | -7.5 | 598 | 545 | -8.9 | 5 | 62 | ## |
| Halifax | 3,564 | 3,750 | 5.2 | 13,468 | 13,549 | 0.6 | 374 | 127 | -66 |
| Hamilton | 386 | 376 | -2.6 | 7,421 | 6,994 | -5.8 | 113 | 452 | ## |
| Kamloops | 697 | 333 | -52.2 | 912 | 1,252 | 37.3 | 124 | 28 | -77.4 |
| Kelowna | 1,355 | 1,376 | 1.5 | 4,787 | 4,442 | -7.2 | 554 | 537 | -3.1 |
| Kingston | 406 | 619 | 52.5 | 1,841 | 1,835 | -0.3 | 19 | 12 | -36.8 |
| Kitchener – Cambridge – Waterloo | 1,620 | 780 | -51.9 | 7,397 | 7,997 | 8.1 | 367 | 253 | -31.1 |
| Lethbridge | 282 | 360 | 27.7 | 851 | 836 | -1.8 | 36 | 33 | -8.3 |
| London | 2,462 | 1,616 | -34.4 | 5,837 | 6,738 | 15.4 | 90 | 64 | -28.9 |
| Moncton | 668 | 603 | -9.7 | 3,392 | 3,467 | 2.2 | 237 | 171 | -27.8 |
| Montréal | 22,797 | 20,546 | -9.9 | 33,545 | 34,410 | 2.6 | 1,807 | 1,537 | -14.9 |
| Nanaimo | 485 | 258 | -46.8 | 915 | 1,126 | 23.1 | 11 | 28 | 154.5 |
| Oshawa | 958 | 755 | -21.2 | 3,336 | 2,760 | -17.3 | 72 | 614 | ## |
| Ottawa – Gatineau | 6,922 | 6,011 | -13.2 | 21,264 | 21,555 | 1.4 | 1,063 | 975 | -8.3 |
| Gatineau | 2,261 | 2,090 | -7.6 | 4,008 | 4,229 | 5.5 | 307 | 138 | -55 |
| Ottawa | 4,661 | 3,921 | -15.9 | 17,256 | 17,326 | 0.4 | 756 | 837 | 10.7 |
| Peterborough | 60 | 122 | 103.3 | 71 | 62 | -12.7 | 19 | 9 | -52.6 |
| Québec | 7,762 | 7,891 | 1.7 | 10,350 | 10,844 | 4.8 | 232 | 426 | 83.6 |
| Red Deer | 31 | 40 | 29 | 433 | 422 | -2.5 | 21 | 21 | 0 |
| Regina | 505 | 181 | -64.2 | 1,460 | 1,781 | 22 | 33 | 81 | 145.5 |
| Saguenay | 851 | 817 | -4 | 1,061 | 1,045 | -1.5 | 58 | 88 | 51.7 |
| St. Catharines – Niagara | 907 | 830 | -8.5 | 4,305 | 4,350 | 1 | 101 | 47 | -53.5 |
| Saint John | 418 | 488 | 16.7 | 998 | 970 | -2.8 | 88 | 35 | -60.2 |
| St. John's | 541 | 413 | -23.7 | 775 | 851 | 9.8 | 65 | 119 | 83.1 |
| Saskatoon | 1,680 | 1,887 | 12.3 | 4,316 | 4,042 | -6.3 | 161 | 468 | 190.7 |
| Sherbrooke | 554 | 449 | -19 | 2,119 | 2,040 | -3.7 | 72 | 206 | 186.1 |
| Thunder Bay | 268 | 192 | -28.4 | 365 | 359 | -1.6 | 8 | 13 | 62.5 |
| Toronto | 19,380 | 17,732 | -8.5 | 88,714 | 90,550 | 2.1 | 1,937 | 1,376 | -29 |
| Trois-Rivières | 643 | 656 | 2 | 977 | 1,012 | 3.6 | 103 | 17 | -83.5 |
| Vancouver | 34,304 | 35,830 | 4.4 | 62,130 | 61,945 | -0.3 | 2,170 | 2,345 | 8.1 |
| Victoria | 2,243 | 1,492 | -33.5 | 8,427 | 9,262 | 9.9 | 313 | 48 | -84.7 |
| Windsor | 424 | 265 | -37.5 | 1,465 | 1,598 | 9.1 | 121 | 75 | -38 |
| Winnipeg | 4,153 | 4,142 | -0.3 | 8,199 | 8,773 | 7 | 321 | 188 | -41.4 |
| CMA Total | 145,450 | 138,890 | -4.5 | 354,893 | 360,157 | 1.5 | 14,798 | 14,755 | -0.3 |
*Units with approved building permits (excluding conversions) that have not yet begun construction and are not yet counted as housing starts. These units, where no construction activity has yet been observed through CMHC’s Starts and Completions Survey (SCS), may be indicative of future housing starts.
## not calculable / extreme value
Source: CMHC Starts and Completions Survey (SCS)
© 2026 Canada Mortgage and Housing Corporation
| Single-Detached | All Others | Total | |||||||
|---|---|---|---|---|---|---|---|---|---|
| Mar. 2026 | Apr. 2026 | % | Mar. 2026 | Apr. 2026 | % | Mar. 2026 | Apr. 2026 | % | |
| N.L. | 753 | 701 | -7 | 481 | 763 | 59 | 1,233 | 1,464 | 19 |
| P.E.I. | 296 | 267 | -10 | 852 | 976 | 15 | 1,148 | 1,243 | 8 |
| N.S. | 1,471 | 1,448 | -2 | 5,769 | 5,156 | -11 | 7,240 | 6,604 | -9 |
| N.B. | 1,101 | 1,084 | -2 | 4,744 | 4,651 | -2 | 5,845 | 5,736 | -2 |
| Que. | 5,351 | 5,379 | 1 | 54,693 | 55,487 | 1 | 60,043 | 60,866 | 1 |
| Ont. | 9,855 | 9,523 | -3 | 52,933 | 59,936 | 13 | 62,788 | 69,459 | 11 |
| Man. | 2,150 | 2,133 | -1 | 5,218 | 5,808 | 11 | 7,368 | 7,941 | 8 |
| Sask. | 1,937 | 1,864 | -4 | 2,524 | 2,520 | 0 | 4,461 | 4,384 | -2 |
| Alta. | 13,103 | 13,110 | 0 | 32,944 | 29,695 | -10 | 46,047 | 42,805 | -7 |
| B.C. | 4,414 | 4,150 | -6 | 35,716 | 39,549 | 11 | 40,129 | 43,699 | 9 |
| Canada (10,000+) | 40,429 | 39,660 | -2 | 195,872 | 204,542 | 4 | 236,301 | 244,202 | 3 |
| Canada (All Areas) | 46,798 | 45,902 | -2 | 201,966 | 210,875 | 4 | 248,764 | 256,777 | 3 |
Data based on 2021 Census Definitions.
Source: CMHC
| Single-Detached | All Others | Total | |||||||
|---|---|---|---|---|---|---|---|---|---|
| Mar. 2026 | Apr. 2026 | % | Mar. 2026 | Apr. 2026 | % | Mar. 2026 | Apr. 2026 | % | |
| Abbotsford – Mission | 199 | 187 | -6 | 616 | 548 | -11 | 815 | 735 | -10 |
| Barrie | 195 | 230 | 18 | 320 | 202 | -37 | 515 | 432 | -16 |
| Belleville – Quinte West | 146 | 126 | -14 | 244 | 184 | -25 | 390 | 310 | -21 |
| Brantford | 323 | 316 | -2 | 760 | 840 | 11 | 1,083 | 1,156 | 7 |
| Calgary | 5,819 | 5,827 | 0 | 18,192 | 14,650 | -19 | 24,010 | 20,477 | -15 |
| Chilliwack | 141 | 125 | -11 | 260 | 850 | 227 | 401 | 975 | 143 |
| Drummondville | 215 | 228 | 6 | 1,158 | 1,428 | 23 | 1,373 | 1,656 | 21 |
| Edmonton | 5,448 | 5,478 | 1 | 11,796 | 12,198 | 3 | 17,244 | 17,676 | 3 |
| Fredericton | 289 | 284 | -2 | 1,024 | 674 | -34 | 1,313 | 958 | -27 |
| Greater / Grand Sudbury | 95 | 84 | -12 | 338 | 338 | - | 433 | 422 | -3 |
| Guelph | 34 | 33 | -3 | 414 | 416 | 0 | 448 | 449 | 0 |
| Halifax | 752 | 678 | -10 | 4,474 | 3,826 | -14 | 5,226 | 4,504 | -14 |
| Hamilton | 304 | 306 | 1 | 3,250 | 3,162 | -3 | 3,554 | 3,468 | -2 |
| Kamloops | 131 | 134 | 2 | 970 | 1,682 | 73 | 1,101 | 1,816 | 65 |
| Kelowna | 253 | 224 | -11 | 1,848 | 1,780 | -4 | 2,101 | 2,004 | -5 |
| Kingston | 296 | 243 | -18 | 312 | 200 | -36 | 608 | 443 | -27 |
| Kitchener – Cambridge – Waterloo | 489 | 391 | -20 | 3,668 | 5,236 | 43 | 4,157 | 5,627 | 35 |
| Lethbridge | 332 | 322 | -3 | 486 | 490 | 1 | 818 | 812 | -1 |
| London | 388 | 422 | 9 | 3,088 | 4,630 | 50 | 3,476 | 5,052 | 45 |
| Moncton | 362 | 370 | 2 | 2,157 | 2,422 | 12 | 2,519 | 2,793 | 11 |
| Montréal | 1,410 | 1,339 | -5 | 25,579 | 24,712 | -3 | 26,988 | 26,051 | -3 |
| Nanaimo | 100 | 119 | 19 | 246 | 634 | 158 | 347 | 753 | 117 |
| Oshawa | 534 | 487 | -9 | 402 | 342 | -15 | 936 | 829 | -11 |
| Ottawa – Gatineau | 1,918 | 1,945 | 1 | 12,580 | 13,410 | 7 | 14,497 | 15,355 | 6 |
| Gatineau | 357 | 380 | 6 | 1,962 | 2,459 | 25 | 2,319 | 2,839 | 22 |
| Ottawa | 1,561 | 1,565 | 0 | 10,618 | 10,951 | 3 | 12,178 | 12,516 | 3 |
| Peterborough | 79 | 65 | -18 | 22 | 22 | - | 100 | 87 | -13 |
| Québec | 732 | 737 | 1 | 6,782 | 6,506 | -4 | 7,514 | 7,244 | -4 |
| Red Deer | 100 | 79 | -21 | 360 | 358 | -1 | 460 | 437 | -5 |
| Regina | 500 | 503 | 1 | 512 | 1,022 | 100 | 1,012 | 1,525 | 51 |
| Saguenay | 244 | 243 | 0 | 1,128 | 1,134 | 1 | 1,372 | 1,377 | 0 |
| St. Catharines – Niagara | 567 | 585 | 3 | 3,128 | 3,014 | -4 | 3,695 | 3,599 | -3 |
| Saint John | 277 | 260 | -6 | 398 | 370 | -7 | 675 | 630 | -7 |
| St. John's | 602 | 556 | -8 | 324 | 612 | 89 | 926 | 1,168 | 26 |
| Saskatoon | 1,417 | 1,348 | -5 | 1,992 | 1,472 | -26 | 3,409 | 2,820 | -17 |
| Sherbrooke | 245 | 219 | -11 | 2,500 | 2,532 | 1 | 2,745 | 2,751 | 0 |
| Thunder Bay | 76 | 91 | 20 | 228 | 214 | -6 | 304 | 305 | 0 |
| Toronto | 2,518 | 2,338 | -7 | 19,204 | 22,848 | 19 | 21,722 | 25,186 | 16 |
| Trois-Rivières | 154 | 158 | 3 | 1,198 | 832 | -31 | 1,352 | 990 | -27 |
| Vancouver | 2,343 | 2,106 | -10 | 24,998 | 26,296 | 5 | 27,341 | 28,402 | 4 |
| Victoria | 319 | 319 | - | 3,254 | 4,274 | 31 | 3,573 | 4,593 | 29 |
| Windsor | 266 | 286 | 8 | 674 | 990 | 47 | 940 | 1,276 | 36 |
| Winnipeg | 1,842 | 1,841 | 0 | 4,214 | 4,964 | 18 | 6,055 | 6,805 | 12 |
Data based on 2021 Census Definitions.
Source: CMHC
| Single-Detached | All Others | Total | |||||||
|---|---|---|---|---|---|---|---|---|---|
| 2025 | 2026 | % | 2025 | 2026 | % | 2025 | 2026 | % | |
| N.L. | 126 | 113 | -10 | 107 | 257 | 140 | 233 | 370 | 59 |
| P.E.I. | 68 | 45 | -34 | 397 | 411 | 4 | 465 | 456 | -2 |
| N.S. | 350 | 330 | -6 | 2,173 | 1,332 | -39 | 2,523 | 1,662 | -34 |
| N.B. | 115 | 119 | 3 | 742 | 851 | 15 | 857 | 970 | 13 |
| Atlantic | 659 | 607 | -8 | 3,419 | 2,851 | -17 | 4,078 | 3,458 | -15 |
| Que. | 1,129 | 1,324 | 17 | 13,296 | 14,826 | 12 | 14,425 | 16,150 | 12 |
| Ont. | 2,384 | 2,225 | -7 | 13,888 | 18,198 | 31 | 16,272 | 20,423 | 26 |
| Man. | 684 | 643 | -6 | 1,173 | 1,826 | 56 | 1,857 | 2,469 | 33 |
| Sask. | 452 | 435 | -4 | 1,478 | 901 | -39 | 1,930 | 1,336 | -31 |
| Alta. | 4,867 | 3,775 | -22 | 11,897 | 9,087 | -24 | 16,764 | 12,862 | -23 |
| Prairies | 6,003 | 4,853 | -19 | 14,548 | 11,814 | -19 | 20,551 | 16,667 | -19 |
| B.C. | 1,115 | 1,086 | -3 | 10,799 | 13,227 | 22 | 11,914 | 14,313 | 20 |
| Canada | 11,290 | 10,095 | -11 | 55,950 | 60,916 | 9 | 67,240 | 71,011 | 6 |
1 Data for 2024, 2025 and 2026 based on 2021 Census Definitions.
Source: CMHC Starts and Completion Survey, Market Absorption Survey
| Single-Detached | All Others | Total | |||||||
|---|---|---|---|---|---|---|---|---|---|
| 2025 | 2026 | % | 2025 | 2026 | % | 2025 | 2026 | % | |
| Abbotsford – Mission | 40 | 37 | -8 | 857 | 226 | -74 | 897 | 263 | -71 |
| Barrie | 21 | 44 | 110 | 98 | 48 | -51 | 119 | 92 | -23 |
| Belleville – Quinte West | 32 | 20 | -38 | 165 | 4 | -98 | 197 | 24 | -88 |
| Brantford | 88 | 101 | 15 | 580 | 399 | -31 | 668 | 500 | -25 |
| Calgary | 2,328 | 1,758 | -24 | 7,045 | 4,504 | -36 | 9,373 | 6,262 | -33 |
| Chilliwack | 38 | 35 | -8 | 237 | 341 | 44 | 275 | 376 | 37 |
| Drummondville | 72 | 64 | -11 | 254 | 404 | 59 | 326 | 468 | 44 |
| Edmonton | 2,092 | 1,548 | -26 | 3,864 | 3,558 | -8 | 5,956 | 5,106 | -14 |
| Fredericton | 25 | 23 | -8 | 125 | 94 | -25 | 150 | 117 | -22 |
| Greater/Grand Sudbury | 8 | 13 | 63 | 5 | 42 | ## | 13 | 55 | 323 |
| Guelph | 7 | 3 | -57 | 7 | 46 | ## | 14 | 49 | 250 |
| Halifax | 210 | 166 | -21 | 2,067 | 933 | -55 | 2,277 | 1,099 | -52 |
| Hamilton | 55 | 55 | - | 625 | 670 | 7 | 680 | 725 | 7 |
| Kamloops | 41 | 46 | 12 | 106 | 794 | ## | 147 | 840 | 471 |
| Kelowna | 72 | 44 | -39 | 668 | 648 | -3 | 740 | 692 | -6 |
| Kingston | 47 | 47 | - | 216 | 12 | -94 | 263 | 59 | -78 |
| Kitchener – Cambridge – Waterloo | 96 | 105 | 9 | 1,018 | 2,038 | 100 | 1,114 | 2,143 | 92 |
| Lethbridge | 82 | 65 | -21 | 142 | 197 | 39 | 224 | 262 | 17 |
| London | 142 | 107 | -25 | 225 | 1,858 | ## | 367 | 1,965 | 435 |
| Moncton | 30 | 35 | 17 | 547 | 653 | 19 | 577 | 688 | 19 |
| Montréal | 347 | 301 | -13 | 6,939 | 6,934 | 0 | 7,286 | 7,235 | -1 |
| Nanaimo | 29 | 43 | 48 | 105 | 282 | 169 | 134 | 325 | 143 |
| Oshawa | 64 | 68 | 6 | 102 | 51 | -50 | 166 | 119 | -28 |
| Ottawa – Gatineau | 522 | 469 | -10 | 3,671 | 3,753 | 2 | 4,193 | 4,222 | 1 |
| Gatineau | 67 | 86 | 28 | 626 | 1,062 | 70 | 693 | 1,148 | 66 |
| Ottawa | 455 | 383 | -16 | 3,045 | 2,691 | -12 | 3,500 | 3,074 | -12 |
| Peterborough | 18 | 13 | -28 | 3 | 11 | 267 | 21 | 24 | 14 |
| Québec | 193 | 215 | 11 | 1,972 | 2,449 | 24 | 2,165 | 2,664 | 23 |
| Red Deer | 40 | 26 | -35 | 17 | 146 | ## | 57 | 172 | 202 |
| Regina | 99 | 114 | 15 | 693 | 457 | -34 | 792 | 571 | -28 |
| Saguenay | 58 | 65 | 12 | 151 | 375 | 148 | 209 | 440 | 111 |
| St. Catharines – Niagara | 100 | 164 | 64 | 390 | 729 | 87 | 490 | 893 | 82 |
| Saint John | 34 | 38 | 12 | 27 | 28 | 4 | 61 | 66 | 8 |
| St. John's | 121 | 94 | -22 | 105 | 218 | 108 | 226 | 312 | 38 |
| Saskatoon | 326 | 314 | -4 | 719 | 434 | -40 | 1,045 | 748 | -28 |
| Sherbrooke | 70 | 56 | -20 | 380 | 797 | 110 | 450 | 853 | 90 |
| Thunder Bay | 5 | 7 | 40 | 20 | 101 | 405 | 25 | 108 | 332 |
| Toronto | 795 | 533 | -33 | 6,567 | 7,436 | 13 | 7,362 | 7,969 | 8 |
| Trois-Rivières | 50 | 30 | -40 | 226 | 265 | 17 | 276 | 295 | 7 |
| Vancouver | 574 | 568 | -1 | 7,345 | 8,296 | 13 | 7,919 | 8,864 | 12 |
| Victoria | 69 | 78 | 13 | 934 | 1,478 | 58 | 1,003 | 1,556 | 55 |
| Windsor | 75 | 55 | -27 | 108 | 217 | 101 | 183 | 272 | 49 |
| Winnipeg | 620 | 583 | -6 | 982 | 1,593 | 62 | 1,602 | 2,176 | 36 |
| Total | 9,735 | 8,150 | -16 | 50,307 | 53,519 | 6 | 60,042 | 61,669 | 3 |
1 Data for 2024, 2025 and 2026 based on 2021 Census Definitions.
Source: CMHC Starts and Completion Survey, Market Absorption Survey
| Single-Detached | All Others | Total | |||||||
|---|---|---|---|---|---|---|---|---|---|
| Apr. 2025 | Apr. 2026 | % | Apr. 2025 | Apr. 2026 | % | Apr. 2025 | Apr. 2026 | % | |
| N.-L. | 54 | 30 | -44 | 56 | 170 | 204 | 110 | 200 | 82 |
| P.E.I. | 26 | 6 | -77 | 150 | 88 | -41 | 176 | 94 | -47 |
| N.S. | 129 | 106 | -18 | 890 | 249 | -72 | 1,019 | 355 | -65 |
| N.B. | 36 | 34 | -6 | 148 | 241 | 63 | 184 | 275 | 49 |
| Atlantic | 245 | 176 | -28 | 1,244 | 748 | -40 | 1,489 | 924 | -38 |
| Que. | 427 | 411 | -4 | 3,861 | 4,530 | 17 | 4,288 | 4,941 | 15 |
| Ont. | 798 | 657 | -18 | 4,536 | 6,023 | 33 | 5,334 | 6,680 | 25 |
| Man. | 225 | 207 | -8 | 270 | 596 | 121 | 495 | 803 | 62 |
| Sask. | 147 | 138 | -6 | 488 | 448 | -8 | 635 | 586 | -8 |
| Alta. | 1,588 | 1,188 | -25 | 3,706 | 2,004 | -46 | 5,294 | 3,192 | -40 |
| Prairies | 1,960 | 1,533 | -22 | 4,464 | 3,048 | -32 | 6,424 | 4,581 | -29 |
| B.C. | 356 | 286 | -20 | 4,047 | 4,393 | 9 | 4,403 | 4,679 | 6 |
| Canada (10,000+) | 3,786 | 3,063 | -19 | 18,152 | 18,742 | 3 | 21,938 | 21,805 | -1 |
Data for 2022 based on 2016 Census Definitions and data for 2023, 2024 and 2025 based on 2021 Census Definitions.
Source: CMHC Starts and Completion Survey, Market Absorption Survey
## not calculable / extreme value
| Single-Detached | All Others | Total | |||||||
|---|---|---|---|---|---|---|---|---|---|
| Apr. 2025 | Apr. 2026 | % | Apr. 2025 | Apr. 2026 | % | Apr. 2025 | Apr. 2026 | % | |
| Abbotsford – Mission | 13 | 15 | 15 | 202 | 178 | -12 | 215 | 193 | -10 |
| Barrie | 5 | 21 | 320 | 34 | 1 | -97 | 39 | 22 | -44 |
| Belleville – Quinte West | 11 | 8 | -27 | 0 | 0 | - | 11 | 8 | -27 |
| Brantford | 39 | 28 | -28 | 269 | 71 | -74 | 308 | 99 | -68 |
| Calgary | 821 | 515 | -37 | 2,281 | 742 | -67 | 3,102 | 1,257 | -59 |
| Chilliwack | 11 | 9 | -18 | 121 | 315 | 160 | 132 | 324 | 145 |
| Drummondville | 26 | 29 | 12 | 57 | 214 | 275 | 83 | 243 | 193 |
| Edmonton | 604 | 525 | -13 | 1,257 | 1,180 | -6 | 1,861 | 1,705 | -8 |
| Fredericton | 5 | 5 | - | 0 | 2 | ## | 5 | 7 | 40 |
| Greater / Grand Sudbury | 3 | 6 | 100 | 0 | 6 | ## | 3 | 12 | 300 |
| Guelph | 3 | 0 | ### | 6 | 9 | 50 | 9 | 9 | - |
| Halifax | 56 | 49 | -13 | 860 | 147 | -83 | 916 | 196 | -79 |
| Hamilton | 14 | 13 | -7 | 179 | 14 | -92 | 193 | 27 | -86 |
| Kamloops | 8 | 10 | 25 | 4 | 358 | ## | 12 | 368 | ## |
| Kelowna | 22 | 5 | -77 | 177 | 128 | -28 | 199 | 133 | -33 |
| Kingston | 18 | 6 | -67 | 33 | 0 | -100 | 51 | 6 | -88 |
| Kitchener – Cambridge – Waterloo | 26 | 30 | 15 | 229 | 825 | 260 | 255 | 855 | 235 |
| Lethbridge | 20 | 16 | -20 | 20 | 2 | -90 | 40 | 18 | -55 |
| London | 41 | 33 | -20 | 30 | 934 | ## | 71 | 967 | ## |
| Moncton | 15 | 18 | 20 | 126 | 227 | 80 | 141 | 245 | 74 |
| Montréal | 134 | 111 | -17 | 1,825 | 2,254 | 24 | 1,959 | 2,365 | 21 |
| Nanaimo | 9 | 27 | 200 | 18 | 214 | ## | 27 | 241 | ## |
| Oshawa | 43 | 4 | -91 | 35 | 6 | -83 | 78 | 10 | -87 |
| Ottawa – Gatineau | 170 | 129 | -24 | 1,414 | 1,104 | -22 | 1,584 | 1,233 | -22 |
| Gatineau | 24 | 6 | -75 | 123 | 352 | 186 | 147 | 358 | 144 |
| Ottawa | 146 | 123 | -16 | 1,291 | 752 | -42 | 1,437 | 875 | -39 |
| Peterborough | 1 | 0 | ### | 0 | 0 | - | 1 | 0 | ### |
| Québec | 67 | 78 | 16 | 621 | 846 | 36 | 688 | 924 | 34 |
| Red Deer | 11 | 10 | -9 | 0 | 0 | - | 11 | 10 | -9 |
| Regina | 19 | 30 | 58 | 262 | 369 | 41 | 281 | 399 | 42 |
| Saguenay | 29 | 26 | -10 | 13 | 46 | 254 | 42 | 72 | 71 |
| St. Catharines – Niagara | 23 | 51 | 122 | 56 | 42 | -25 | 79 | 93 | 18 |
| Saint John | 11 | 5 | -55 | 1 | 2 | 100 | 12 | 7 | -42 |
| St. John's | 50 | 26 | -48 | 54 | 169 | 213 | 104 | 195 | 88 |
| Saskatoon | 123 | 102 | -17 | 215 | 71 | -67 | 338 | 173 | -49 |
| Sherbrooke | 33 | 16 | -52 | 162 | 121 | -25 | 195 | 137 | -30 |
| Thunder Bay | 2 | 2 | - | 0 | 5 | ## | 2 | 7 | 250 |
| Toronto | 249 | 140 | -44 | 2,041 | 2,940 | 44 | 2,290 | 3,080 | 34 |
| Trois-Rivières | 20 | 14 | -30 | 67 | 34 | -49 | 87 | 48 | -45 |
| Vancouver | 171 | 125 | -27 | 2,914 | 2,033 | -30 | 3,085 | 2,158 | -30 |
| Victoria | 20 | 23 | 15 | 371 | 841 | 127 | 391 | 864 | 121 |
| Windsor | 25 | 26 | 4 | 35 | 190 | 443 | 60 | 216 | 260 |
| Winnipeg | 214 | 188 | -12 | 199 | 578 | 190 | 413 | 766 | 85 |
| Total | 3,185 | 2,474 | -22 | 16,188 | 17,218 | 6 | 19,373 | 19,692 | 2 |
Data for 2022 based on 2016 Census Definitions and data for 2023, 2024 and 2025 based on 2021 Census Definitions.
Source: CMHC Starts and Completion Survey, Market Absorption Survey
## not calculable / extreme value
