


 Share via Email
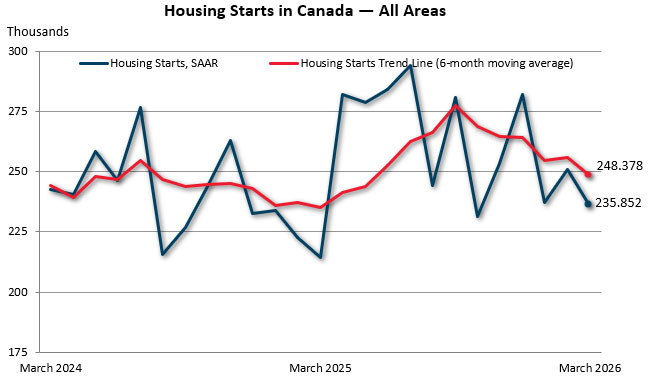
The six-month trend in housing starts was lower in March, with a decrease of 2.9% to 248,378 units, according to Canada Mortgage and Housing Corporation (CMHC). The trend measure is a six-month moving average of the seasonally adjusted annual rate (SAAR) of total housing starts for all areas in Canada.
Actual housing starts were up 10% year-over-year in centres with a population of 10,000 or greater, with 16,398 units recorded in March, compared to 14,935 units in March 2025. The year-to-date total was 49,206 units, up 9% from the same period in 2025, driven by higher starts to begin the year in British Columbia, Ontario and Quebec.
The total monthly SAAR of housing starts for all areas in Canada decreased 6% in March (235,852 units) compared to February (250,961 units).
Quote:
“March housing starts data point to a continued loss of momentum in housing construction, broadly in line with CMHC’s housing market outlook. While actual starts increased compared to a year ago, this largely reflects the exceptionally low level of construction activity in the first quarter of last year,” said Mathieu Laberge, CMHC’s Chief Economist and Senior Vice‑President, Housing Insights. “Monthly housing starts can be volatile and difficult to reconcile with conditions experienced by builders and developers on the ground. This is why we are providing new analysis this month on the relationship between building permits and housing starts, as well as the release of new data on non‑market housing starts.”
Canada’s Construction Pulse: Permits Lead, Starts Confirm
This new analysis from CMHC’s Chief Economist, Mathieu Laberge, examines the roles of housing starts and building permits in the residential construction continuum. Housing starts are a key indicator of residential construction in Canada, showing the volume of construction in progress and how much new housing supply is expected in the coming years. Building permits signal where housing starts activity is headed, offering greater insight into current market conditions. Taken together, the two measures provide a more complete picture of the trajectory of the residential construction market.
Key facts:
- New this quarter: CMHC data now reports on non-market housing starts by intended market and by dwelling type. Data in this series is reported at the zone geography level for 18 Census Metropolitan Areas (CMAs) across Canada. Non-market starts include dwellings developed or operated by public, non‑profit, co‑operative, or other community‑based organizations under social, supportive, public, or non‑market affordable housing programs. Non-market starts data will be published on a quarterly basis and can be found on CMHC’s website.
- The rural starts monthly SAAR estimate was 11,846 units.
- Among Canada’s three biggest CMAs, Montreal posted an 26% year-over-year increase in actual housing starts this month driven by higher multi-unit. Vancouver recorded a 21% increase due to higher multi-unit and single-detached starts. Toronto starts increased 23% due to higher multi-unit starts.
- Read more about why housing starts matter on CMHC’s Housing Observer.
- Monthly Housing Starts and Other Construction Data are accessible in English and French on our website and the CMHC Housing Market Information Portal.
- Housing starts data is available on the eleventh business day each month. We will release the March housing starts data on May 15 at 8:15 AM ET.
- CMHC uses the trend measure as a complement to the monthly SAAR of housing starts to account for considerable swings in monthly estimates and to obtain a clearer picture of upcoming new housing supply. In some situations, analyzing only SAAR data can be misleading, as the multi-unit segment largely drives the market and can vary significantly from one month to the next.
- Read about CMHC's definitions and methodology to better understand the foundations of the Starts and Completions and Market Absorption surveys.
Housing starts facilitate the analysis of monthly, quarterly, and year-over-year activity in the new home market. The data CMHC collects as part of the Starts and Completions and Market Absorption surveys helps us obtain a clearer picture of upcoming new housing supply and is used as part of our various housing reports.
For 80 years, CMHC has played a critical role as a national convenor to promote stability and sustainability in Canada’s housing finance system. CMHC’s mortgage insurance products support access to home ownership and the creation and maintenance of rental supply. CMHC research and data help inform housing policy. By facilitating cooperation between all levels of government, private and non-profit sectors, CMHC contributes to advancing housing affordability, equity, and climate compatibility. CMHC actively supports the Government of Canada in delivering on its commitment to make housing more affordable.
Follow us on X, YouTube, LinkedIn, Facebook and Instagram.
Related links:
- Housing starts for February 2026
- Spring 2026 Housing Supply Report
- CMHC’s 2026 Housing Market Outlook
- We built this city on… Development charges
- Framework for change: Productivity in housing construction
Information on this release:
To request an interview with a CMHC economist, contact:
Media Relations, CMHC
media@cmhc-schl.gc.ca
| Single-Detached | All Others | Total | |||||||
|---|---|---|---|---|---|---|---|---|---|
| Feb. 2026 | Mar. 2026 | % | Feb. 2026 | Mar. 2026 | % | Feb. 2026 | Mar. 2026 | % | |
| N.L. | 793 | 761 | -4 | 500 | 481 | -4 | 1,293 | 1,242 | -4 |
| P.E.I. | 320 | 301 | -6 | 728 | 852 | 17 | 1,048 | 1,153 | 10 |
| N.S. | 1,487 | 1,472 | -1 | 5,938 | 5,769 | -3 | 7,425 | 7,241 | -2 |
| N.B. | 1,084 | 1,138 | 5 | 4,757 | 4,722 | -1 | 5,841 | 5,860 | 0 |
| Que. | 5,334 | 5,395 | 1 | 49,186 | 54,250 | 10 | 54,521 | 59,646 | 9 |
| Ont. | 9,975 | 9,809 | -2 | 58,549 | 52,926 | -10 | 68,524 | 62,735 | -8 |
| Man. | 2,102 | 2,143 | 2 | 5,722 | 5,218 | -9 | 7,824 | 7,361 | -6 |
| Sask. | 2,022 | 1,948 | -4 | 3,406 | 2,524 | -26 | 5,428 | 4,472 | -18 |
| Alta. | 13,432 | 13,110 | -2 | 34,990 | 32,954 | -6 | 48,422 | 46,064 | -5 |
| B.C. | 4,372 | 4,425 | 1 | 36,756 | 35,707 | -3 | 41,128 | 40,133 | -2 |
| Canada (10,000+) | 40,921 | 40,503 | -1 | 200,533 | 195,404 | -3 | 241,454 | 235,906 | -2 |
| Canada (All Areas) | 48,634 | 46,880 | -4 | 207,242 | 201,499 | -3 | 255,874 | 248,378 | -3 |
Data based on 2021 Census Definitions.
Source: Market Analysis Centre, CMHC
| Single-Detached | All Others | Total | |||||||
|---|---|---|---|---|---|---|---|---|---|
| Feb. 2026 | Mar. 2026 | % | Feb. 2026 | Mar. 2026 | % | Feb. 2026 | Mar. 2026 | % | |
| Abbotsford – Mission | 176 | 202 | 15 | 1,034 | 616 | -40 | 1,210 | 818 | -32 |
| Barrie | 220 | 181 | -18 | 316 | 320 | 1 | 536 | 501 | -7 |
| Belleville – Quinte West | 139 | 147 | 6 | 400 | 244 | -39 | 539 | 391 | -27 |
| Brantford | 324 | 325 | 0 | 666 | 760 | 14 | 991 | 1,085 | 9 |
| Calgary | 5,923 | 5,831 | -2 | 19,026 | 18,192 | -4 | 24,949 | 24,023 | -4 |
| Chilliwack | 133 | 144 | 8 | 428 | 260 | -39 | 561 | 404 | -28 |
| Drummondville | 240 | 215 | -10 | 1,206 | 1,158 | -4 | 1,446 | 1,373 | -5 |
| Edmonton | 5,559 | 5,421 | -2 | 13,212 | 11,796 | -11 | 18,771 | 17,217 | -8 |
| Fredericton | 303 | 291 | -4 | 1,088 | 1,024 | -6 | 1,391 | 1,315 | -5 |
| Greater / Grand Sudbury | 98 | 96 | -2 | 284 | 338 | 19 | 382 | 434 | 14 |
| Guelph | 34 | 34 | - | 458 | 414 | -10 | 492 | 448 | -9 |
| Halifax | 789 | 751 | -5 | 4,690 | 4,474 | -5 | 5,479 | 5,225 | -5 |
| Hamilton | 292 | 302 | 3 | 3,258 | 3,250 | 0 | 3,550 | 3,552 | 0 |
| Kamloops | 130 | 131 | 1 | 948 | 970 | 2 | 1,078 | 1,101 | 2 |
| Kelowna | 277 | 256 | -8 | 1,982 | 1,848 | -7 | 2,259 | 2,104 | -7 |
| Kingston | 267 | 299 | 12 | 318 | 312 | -2 | 585 | 611 | 4 |
| Kitchener – Cambridge – Waterloo | 514 | 485 | -6 | 6,060 | 3,668 | -39 | 6,574 | 4,153 | -37 |
| Lethbridge | 348 | 332 | -5 | 180 | 486 | 170 | 528 | 818 | 55 |
| London | 394 | 389 | -1 | 4,134 | 3,088 | -25 | 4,528 | 3,477 | -23 |
| Moncton | 331 | 364 | 10 | 2,003 | 2,157 | 8 | 2,334 | 2,521 | 8 |
| Montréal | 1,462 | 1,408 | -4 | 25,740 | 25,577 | -1 | 27,202 | 26,986 | -1 |
| Nanaimo | 94 | 99 | 5 | 152 | 246 | 62 | 246 | 345 | 40 |
| Oshawa | 589 | 545 | -7 | 514 | 402 | -22 | 1,103 | 947 | -14 |
| Ottawa – Gatineau | 1,792 | 1,938 | 8 | 11,419 | 12,612 | 10 | 13,212 | 14,551 | 10 |
| Gatineau | 321 | 364 | 13 | 1,302 | 1,964 | 51 | 1,624 | 2,329 | 43 |
| Ottawa | 1,471 | 1,574 | 7 | 10,117 | 10,648 | 5 | 11,588 | 12,222 | 5 |
| Peterborough | 84 | 80 | -5 | 0 | 22 | ## | 84 | 101 | 20 |
| Québec | 767 | 736 | -4 | 6,632 | 6,782 | 2 | 7,398 | 7,518 | 2 |
| Red Deer | 90 | 99 | 10 | 120 | 360 | 200 | 211 | 459 | 118 |
| Regina | 547 | 509 | -7 | 1,002 | 512 | -49 | 1,549 | 1,021 | -34 |
| Saguenay | 243 | 244 | 0 | 762 | 1,128 | 48 | 1,005 | 1,372 | 37 |
| St. Catharines – Niagara | 511 | 565 | 11 | 2,650 | 3,128 | 18 | 3,161 | 3,693 | 17 |
| Saint John | 281 | 283 | 1 | 518 | 398 | -23 | 799 | 681 | -15 |
| St. John's | 675 | 607 | -10 | 390 | 324 | -17 | 1,065 | 931 | -13 |
| Saskatoon | 1,447 | 1,429 | -1 | 2,386 | 1,992 | -17 | 3,833 | 3,421 | -11 |
| Sherbrooke | 249 | 244 | -2 | 2,062 | 2,500 | 21 | 2,311 | 2,743 | 19 |
| Thunder Bay | 81 | 76 | -6 | 324 | 228 | -30 | 405 | 304 | -25 |
| Toronto | 2,801 | 2,509 | -10 | 23,090 | 19,204 | -17 | 25,891 | 21,713 | -16 |
| Trois-Rivières | 160 | 156 | -3 | 1,032 | 1,198 | 16 | 1,192 | 1,354 | 14 |
| Vancouver | 2,314 | 2,349 | 2 | 25,392 | 24,998 | -2 | 27,706 | 27,347 | -1 |
| Victoria | 310 | 321 | 4 | 3,440 | 3,254 | -5 | 3,750 | 3,575 | -5 |
| Windsor | 251 | 265 | 6 | 864 | 674 | -22 | 1,115 | 939 | -16 |
| Winnipeg | 1,795 | 1,826 | 2 | 4,676 | 4,214 | -10 | 6,470 | 6,040 | -7 |
Data based on 2021 Census Definitions.
Source: Market Analysis Centre, CMHC
| Single-Detached | All Others | Total | |||||||
|---|---|---|---|---|---|---|---|---|---|
| 2025 | 2026 | % | 2025 | 2026 | % | 2025 | 2026 | % | |
| N.L. | 72 | 83 | 15 | 51 | 87 | 71 | 123 | 170 | 38 |
| P.E.I. | 42 | 39 | -7 | 247 | 323 | 31 | 289 | 362 | 25 |
| N.S. | 221 | 224 | 1 | 1,283 | 1,083 | -16 | 1,504 | 1,307 | -13 |
| N.B. | 79 | 85 | 8 | 594 | 610 | 3 | 673 | 695 | 3 |
| Atlantic | 414 | 431 | 4 | 2,175 | 2,103 | -3 | 2,589 | 2,534 | -2 |
| Que. | 702 | 913 | 30 | 9,435 | 10,296 | 9 | 10,137 | 11,209 | 11 |
| Ont. | 1,586 | 1,568 | -1 | 9,352 | 12,175 | 30 | 10,938 | 13,743 | 26 |
| Man. | 459 | 436 | -5 | 903 | 1,230 | 36 | 1,362 | 1,666 | 22 |
| Sask. | 305 | 297 | -3 | 990 | 453 | -54 | 1,295 | 750 | -42 |
| Alta. | 3,279 | 2,587 | -21 | 8,191 | 7,083 | -14 | 11,470 | 9,670 | -16 |
| Prairies | 4,043 | 3,320 | -18 | 10,084 | 8,766 | -13 | 14,127 | 12,086 | -14 |
| B.C. | 759 | 800 | 5 | 6,752 | 8,834 | 31 | 7,511 | 9,634 | 28 |
| Canada | 7,504 | 7,032 | -6 | 37,798 | 42,174 | 12 | 45,302 | 49,206 | 9 |
1 Data for 2023, 2024 and 2025 based on 2021 Census Definitions.
Source: CMHC Starts and Completion Survey, Market Absorption Survey
| Single-Detached | All Others | Total | |||||||
|---|---|---|---|---|---|---|---|---|---|
| 2025 | 2026 | % | 2025 | 2026 | % | 2025 | 2026 | % | |
| Abbotsford – Mission | 27 | 22 | -19 | 655 | 48 | -93 | 682 | 70 | -90 |
| Barrie | 16 | 23 | 44 | 64 | 47 | -27 | 80 | 70 | -13 |
| Belleville – Quinte West | 21 | 12 | -43 | 165 | 4 | -98 | 186 | 16 | -91 |
| Brantford | 49 | 73 | 49 | 311 | 328 | 5 | 360 | 401 | 11 |
| Calgary | 1,507 | 1,243 | -18 | 4,764 | 3,762 | -21 | 6,271 | 5,005 | -20 |
| Chilliwack | 27 | 26 | -4 | 116 | 26 | -78 | 143 | 52 | -64 |
| Drummondville | 46 | 35 | -24 | 197 | 190 | -4 | 243 | 225 | -7 |
| Edmonton | 1,488 | 1,023 | -31 | 2,607 | 2,378 | -9 | 4,095 | 3,401 | -17 |
| Fredericton | 20 | 18 | -10 | 125 | 92 | -26 | 145 | 110 | -24 |
| Greater/Grand Sudbury | 5 | 7 | 40 | 5 | 36 | ## | 10 | 43 | 330 |
| Guelph | 4 | 3 | -25 | 1 | 37 | ## | 5 | 40 | ## |
| Halifax | 154 | 117 | -24 | 1,207 | 786 | -35 | 1,361 | 903 | -34 |
| Hamilton | 41 | 42 | 2 | 446 | 656 | 47 | 487 | 698 | 43 |
| Kamloops | 33 | 36 | 9 | 102 | 436 | 327 | 135 | 472 | 250 |
| Kelowna | 50 | 39 | -22 | 491 | 520 | 6 | 541 | 559 | 3 |
| Kingston | 29 | 41 | 41 | 183 | 12 | -93 | 212 | 53 | -75 |
| Kitchener – Cambridge – Waterloo | 70 | 75 | 7 | 789 | 1,213 | 54 | 859 | 1,288 | 50 |
| Lethbridge | 62 | 49 | -21 | 122 | 195 | 60 | 184 | 244 | 33 |
| London | 101 | 74 | -27 | 195 | 924 | 374 | 296 | 998 | 237 |
| Moncton | 15 | 17 | 13 | 421 | 426 | 1 | 436 | 443 | 2 |
| Montréal | 213 | 190 | -11 | 5,114 | 4,680 | -8 | 5,327 | 4,870 | -9 |
| Nanaimo | 20 | 16 | -20 | 87 | 68 | -22 | 107 | 84 | -21 |
| Oshawa | 21 | 64 | 205 | 67 | 45 | -33 | 88 | 109 | 24 |
| Ottawa – Gatineau | 352 | 340 | -3 | 2,257 | 2,649 | 17 | 2,609 | 2,989 | 15 |
| Gatineau | 43 | 80 | 86 | 503 | 710 | 41 | 546 | 790 | 45 |
| Ottawa | 309 | 260 | -16 | 1,754 | 1,939 | 11 | 2,063 | 2,199 | 7 |
| Peterborough | 17 | 13 | -24 | 3 | 11 | 267 | 20 | 24 | 20 |
| Québec | 126 | 137 | 9 | 1,351 | 1,603 | 19 | 1,477 | 1,740 | 18 |
| Red Deer | 29 | 16 | -45 | 17 | 146 | ## | 46 | 162 | 252 |
| Regina | 80 | 84 | 5 | 431 | 88 | -80 | 511 | 172 | -66 |
| Saguenay | 29 | 39 | 34 | 138 | 329 | 138 | 167 | 368 | 120 |
| St. Catharines – Niagara | 77 | 113 | 47 | 334 | 687 | 106 | 411 | 800 | 95 |
| Saint John | 23 | 33 | 43 | 26 | 26 | - | 49 | 59 | 20 |
| St. John's | 71 | 68 | -4 | 51 | 49 | -4 | 122 | 117 | -4 |
| Saskatoon | 203 | 212 | 4 | 504 | 363 | -28 | 707 | 575 | -19 |
| Sherbrooke | 37 | 40 | 8 | 218 | 676 | 210 | 255 | 716 | 181 |
| Thunder Bay | 3 | 5 | 67 | 20 | 96 | 380 | 23 | 101 | 339 |
| Toronto | 546 | 393 | -28 | 4,526 | 4,496 | -1 | 5,072 | 4,889 | -4 |
| Trois-Rivières | 30 | 16 | -47 | 159 | 231 | 45 | 189 | 247 | 31 |
| Vancouver | 403 | 443 | 10 | 4,431 | 6,263 | 41 | 4,834 | 6,706 | 39 |
| Victoria | 49 | 55 | 12 | 563 | 637 | 13 | 612 | 692 | 13 |
| Windsor | 50 | 29 | -42 | 73 | 27 | -63 | 123 | 56 | -54 |
| Winnipeg | 406 | 395 | -3 | 783 | 1,015 | 30 | 1,189 | 1,410 | 19 |
| Total | 6,550 | 5,676 | -13 | 34,119 | 36,301 | 6 | 40,669 | 41,977 | 3 |
1 Data for 2023, 2024 and 2025 based on 2021 Census Definitions.
Source: CMHC Starts and Completion Survey, Market Absorption Survey
| Single-Detached | All Others | Total | |||||||
|---|---|---|---|---|---|---|---|---|---|
| Mar. 2025 | Mar. 2026 | % | Mar. 2025 | Mar. 2026 | % | Mar. 2025 | Mar. 2026 | % | |
| N.-L. | 21 | 15 | -29 | 10 | 10 | - | 31 | 25 | -19 |
| P.E.I. | 14 | 10 | -29 | 9 | 103 | ## | 23 | 113 | 391 |
| N.S. | 88 | 78 | -11 | 364 | 262 | -28 | 452 | 340 | -25 |
| N.B. | 26 | 26 | - | 280 | 224 | -20 | 306 | 250 | -18 |
| Atlantic | 149 | 129 | -13 | 663 | 599 | -10 | 812 | 728 | -10 |
| Que. | 281 | 310 | 10 | 3,278 | 5,195 | 58 | 3,559 | 5,505 | 55 |
| Ont. | 514 | 543 | 6 | 2,447 | 3,519 | 44 | 2,961 | 4,062 | 37 |
| Man. | 151 | 170 | 13 | 480 | 484 | 1 | 631 | 654 | 4 |
| Sask. | 145 | 91 | -37 | 480 | 111 | -77 | 625 | 202 | -68 |
| Alta. | 1,180 | 912 | -23 | 2,778 | 2,104 | -24 | 3,958 | 3,016 | -24 |
| Prairies | 1,476 | 1,173 | -21 | 3,738 | 2,699 | -28 | 5,214 | 3,872 | -26 |
| B.C. | 269 | 288 | 7 | 2,110 | 1,943 | -8 | 2,379 | 2,231 | -6 |
| Canada (10,000+) | 2,689 | 2,443 | -9 | 12,236 | 13,955 | 14 | 14,925 | 16,398 | 10 |
Data for 2022 based on 2016 Census Definitions and data for 2023, 2024 and 2025 based on 2021 Census Definitions.
Source: CMHC Starts and Completion Survey, Market Absorption Survey
## not calculable / extreme value
| Single-Detached | All Others | Total | |||||||
|---|---|---|---|---|---|---|---|---|---|
| Mar. 2025 | Mar. 2026 | % | Mar. 2025 | Mar. 2026 | % | Mar. 2025 | Mar. 2026 | % | |
| Abbotsford – Mission | 13 | 9 | -31 | 223 | 17 | -92 | 236 | 26 | -89 |
| Barrie | 1 | 1 | - | 13 | 11 | -15 | 14 | 12 | -14 |
| Belleville – Quinte West | 5 | 7 | 40 | 0 | 0 | - | 5 | 7 | 40 |
| Brantford | 35 | 27 | -23 | 69 | 115 | 67 | 104 | 142 | 37 |
| Calgary | 455 | 404 | -11 | 1,780 | 1,209 | -32 | 2,235 | 1,613 | -28 |
| Chilliwack | 9 | 12 | 33 | 70 | 9 | -87 | 79 | 21 | -73 |
| Drummondville | 30 | 6 | -80 | 112 | 106 | -5 | 142 | 112 | -21 |
| Edmonton | 620 | 394 | -36 | 786 | 528 | -33 | 1,406 | 922 | -34 |
| Fredericton | 1 | 4 | 300 | 123 | 0 | -100 | 124 | 4 | -97 |
| Greater / Grand Sudbury | 3 | 2 | -33 | 5 | 29 | 480 | 8 | 31 | 288 |
| Guelph | 3 | 0 | ### | 0 | 18 | ## | 3 | 18 | ## |
| Halifax | 63 | 40 | -37 | 346 | 182 | -47 | 409 | 222 | -46 |
| Hamilton | 14 | 14 | - | 19 | 3 | -84 | 33 | 17 | -48 |
| Kamloops | 7 | 6 | -14 | 10 | 13 | 30 | 17 | 19 | 12 |
| Kelowna | 22 | 10 | -55 | 46 | 5 | -89 | 68 | 15 | -78 |
| Kingston | 10 | 6 | -40 | 0 | 0 | - | 10 | 6 | -40 |
| Kitchener – Cambridge – Waterloo | 41 | 31 | -24 | 329 | 34 | -90 | 370 | 65 | -82 |
| Lethbridge | 21 | 20 | -5 | 19 | 155 | ## | 40 | 175 | 338 |
| London | 46 | 29 | -37 | 107 | 531 | 396 | 153 | 560 | 266 |
| Moncton | 4 | 6 | 50 | 149 | 184 | 23 | 153 | 190 | 24 |
| Montréal | 60 | 56 | -7 | 1,870 | 2,380 | 27 | 1,930 | 2,436 | 26 |
| Nanaimo | 12 | 13 | 8 | 8 | 58 | ## | 20 | 71 | 255 |
| Oshawa | 6 | 6 | - | 63 | 0 | -100 | 69 | 6 | -91 |
| Ottawa – Gatineau | 106 | 125 | 18 | 620 | 969 | 56 | 726 | 1,094 | 51 |
| Gatineau | 13 | 25 | 92 | 102 | 371 | 264 | 115 | 396 | 244 |
| Ottawa | 93 | 100 | 8 | 518 | 598 | 15 | 611 | 698 | 14 |
| Peterborough | 2 | 6 | 200 | 2 | 11 | 450 | 4 | 17 | 325 |
| Québec | 57 | 40 | -30 | 370 | 709 | 92 | 427 | 749 | 75 |
| Red Deer | 6 | 4 | -33 | 3 | 129 | ## | 9 | 133 | ## |
| Regina | 41 | 14 | -66 | 33 | 18 | -45 | 74 | 32 | -57 |
| Saguenay | 13 | 18 | 38 | 30 | 239 | ## | 43 | 257 | 498 |
| St. Catharines – Niagara | 33 | 31 | -6 | 62 | 258 | 316 | 95 | 289 | 204 |
| Saint John | 15 | 11 | -27 | 0 | 12 | ## | 15 | 23 | 53 |
| St. John's | 21 | 10 | -52 | 10 | 1 | -90 | 31 | 11 | -65 |
| Saskatoon | 95 | 77 | -19 | 424 | 92 | -78 | 519 | 169 | -67 |
| Sherbrooke | 17 | 4 | -76 | 96 | 441 | 359 | 113 | 445 | 294 |
| Thunder Bay | 0 | 0 | - | 6 | 0 | -100 | 6 | 0 | ### |
| Toronto | 160 | 131 | -18 | 1,065 | 1,374 | 29 | 1,225 | 1,505 | 23 |
| Trois-Rivières | 16 | 7 | -56 | 96 | 175 | 82 | 112 | 182 | 63 |
| Vancouver | 135 | 160 | 19 | 1,288 | 1,556 | 21 | 1,423 | 1,716 | 21 |
| Victoria | 22 | 22 | - | 344 | 110 | -68 | 366 | 132 | -64 |
| Windsor | 19 | 17 | -11 | 9 | 11 | 22 | 28 | 28 | - |
| Winnipeg | 136 | 159 | 17 | 455 | 419 | -8 | 591 | 578 | -2 |
| Total | 2,375 | 1,939 | -18 | 11,060 | 12,111 | 10 | 13,435 | 14,050 | 5 |
Data for 2022 based on 2016 Census Definitions and data for 2023, 2024 and 2025 based on 2021 Census Definitions.
Source: CMHC Starts and Completion Survey, Market Absorption Survey
## not calculable / extreme value
