


 Share via Email
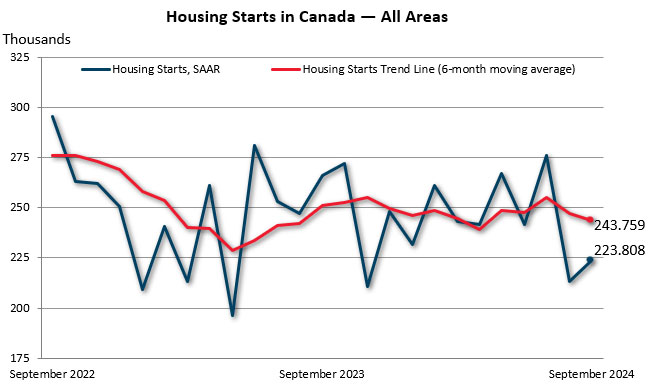
The six-month trend in housing starts decreased 1.3% from 246,972 units in August to 243,759 units in September. The trend measure is a six-month moving average of the seasonally adjusted annual rate (SAAR) of total housing starts for all areas in Canada.
The total monthly SAAR of housing starts for all areas in Canada increased 5% in September (223,808 units) compared to August (213,012 units), according to Canada Mortgage and Housing Corporation (CMHC).
In Canada’s urban centres with a population of 10,000 or greater, there have been 168,897 actual housing starts year-to-date (January – September) in 2024. This compares to 165,559 for the same period in 2023, meaning actual housing starts are currently 2% higher this year.
Quote:
“Growth in actual year-to-date housing starts has been driven by both higher multi-unit and single-detached units in Alberta, Quebec and the Atlantic provinces. By contrast, year-to-date starts in Ontario and British Columbia have decreased across all housing types. Despite the increase in housing starts in September, we remain well below what is required to restore affordability in Canada’s urban centres.” said Kevin Hughes, CMHC’s Deputy Chief Economist.
Key facts:
- The monthly SAAR of total urban (centres 10,000 population and over) housing starts was 6% higher (210,002 units). Multi-unit urban starts increased 6% (163,400 units), while single-detached urban starts increased 5% (46,602 units).
- The rural starts monthly SAAR estimate was 13,806 units.
- Actual year-to-date housing starts between January and September 2024 are up 15% in Montreal from the same period last year, showing some recovery from historically low new home construction in 2023.
- In Vancouver, actual starts are down 19% in 2024 compared to 2023, but it’s important to note 2023 was a record high year.
- In Toronto, actual year-to-date housing starts are down 20% from 2023, which was also a high year for housing starts by historical standards.
- Monthly Housing Starts and Other Construction Data are accessible in English and French on our website and the CMHC Housing Market Information Portal.
- Housing starts data is available on the eleventh business day each month. We will release the October housing starts data on November 18 at 8:15 AM ET.
- CMHC uses the trend measure as a complement to the monthly SAAR of housing starts to account for considerable swings in monthly estimates and to obtain a clearer picture of upcoming new housing supply. In some situations, analyzing only SAAR data can be misleading, as the multi-unit segment largely drives the market and can vary significantly from one month to the next.
- Definitions and methodology to better understand the foundations of the Starts and Completions and Market Absorption surveys.
- Housing starts facilitate the analysis of monthly, quarterly, and year-over-year activity in the new home market. The data we collect as part of our Starts and Completions and Market Absorption surveys helps us obtain a clearer picture of upcoming new housing supply and is used as part of our various housing reports.
CMHC plays a critical role as a national convenor to promote stability and sustainability in Canada’s housing finance system. Our mortgage insurance products support access to home ownership and the creation and maintenance of rental housing supply. Our research and data help inform housing policy. By facilitating cooperation between all levels of government, private and non-profit sectors, we contribute to advancing housing affordability, equity, and climate compatibility. We actively support the Government of Canada in delivering on its commitment to make housing more affordable.
Follow us on LinkedIn, YouTube, Instagram, X (formerly Twitter), and Facebook.
Related links:
- Fall 2024 Housing Supply Report
- Higher rates hindered housing starts in 2023
- Canada’s potential capacity for housing construction
- Housing Starts for August 2024
Information on this release:
To request an interview with a CMHC economist, contact:
Media Relations, CMHC
media@cmhc-schl.gc.ca
| Single-Detached | All Others | Total | |||||||
|---|---|---|---|---|---|---|---|---|---|
| 2023 | 2024 | % | 2023 | 2024 | % | 2023 | 2024 | % | |
| N.-L. | 331 | 458 | 38 | 92 | 232 | 152 | 423 | 690 | 63 |
| P.E.I. | 134 | 189 | 41 | 495 | 896 | 81 | 629 | 1,085 | 72 |
| N.S. | 1,117 | 1,173 | 5 | 2,764 | 4,199 | 52 | 3,881 | 5,372 | 38 |
| N.B. | 664 | 710 | 7 | 2,127 | 2,979 | 40 | 2,791 | 3,689 | 32 |
| Atlantic | 2,246 | 2,530 | 13 | 5,478 | 8,306 | 52 | 7,724 | 10,836 | 40 |
| Qc | 3,068 | 3,126 | 2 | 20,743 | 25,663 | 24 | 23,811 | 28,789 | 21 |
| Ont. | 11,257 | 9,576 | -15 | 55,038 | 46,552 | -15 | 66,295 | 56,128 | -15 |
| Man. | 1,250 | 1,299 | 4 | 3,551 | 3,106 | -13 | 4,801 | 4,405 | -8 |
| Sask. | 725 | 911 | 26 | 2,247 | 2,000 | -11 | 2,972 | 2,911 | -2 |
| Alta. | 8,578 | 11,295 | 32 | 16,326 | 22,282 | 36 | 24,904 | 33,577 | 35 |
| Prairies | 10,553 | 13,505 | 28 | 22,124 | 27,388 | 24 | 32,677 | 40,893 | 25 |
| B.C. | 4,336 | 3,349 | -23 | 30,716 | 28,902 | -6 | 35,052 | 32,251 | -8 |
| Canada (10,000+) | 31,460 | 32,086 | 2 | 134,099 | 136,811 | 2 | 165,559 | 168,897 | 2 |
Data for 2021 and 2022 based on 2016 Census Definitions and data for 2023 and 2024 based on 2021 Census Definitions.
Source: CMHC Starts and Completion Survey, Market Absorption Survey
| Single-Detached | All Others | Total | |||||||
|---|---|---|---|---|---|---|---|---|---|
| 2023 | 2024 | % | 2023 | 2024 | % | 2023 | 2024 | % | |
| Abbotsford – Mission | 187 | 146 | -22 | 350 | 756 | 116 | 537 | 902 | 68 |
| Barrie | 552 | 312 | -43 | 1,305 | 446 | -66 | 1,857 | 758 | -59 |
| Belleville – Quinte West | 150 | 163 | 9 | 129 | 123 | -5 | 279 | 286 | 3 |
| Brantford | 309 | 168 | -46 | 264 | 39 | -85 | 573 | 207 | -64 |
| Calgary | 4,104 | 5,225 | 27 | 10,037 | 12,189 | 21 | 14,141 | 17,414 | 23 |
| Chilliwack | 141 | 121 | -14 | 178 | 278 | 56 | 319 | 399 | 25 |
| Drummondville | 121 | 125 | 3 | 291 | 621 | 113 | 412 | 746 | 81 |
| Edmonton | 3,465 | 4,992 | 44 | 5,634 | 8,367 | 49 | 9,099 | 13,359 | 47 |
| Fredericton | 208 | 226 | 9 | 619 | 280 | -55 | 827 | 506 | -39 |
| Greater / Grand Sudbury | 76 | 61 | -20 | 184 | 58 | -68 | 260 | 119 | -54 |
| Guelph | 56 | 43 | -23 | 1,052 | 342 | -67 | 1,108 | 385 | -65 |
| Halifax | 419 | 604 | 44 | 2,398 | 3,682 | 54 | 2,817 | 4,286 | 52 |
| Hamilton | 222 | 250 | 13 | 1,558 | 1,691 | 9 | 1,780 | 1,941 | 9 |
| Kamloops | 78 | 68 | -13 | 270 | 196 | -27 | 348 | 264 | -24 |
| Kelowna | 339 | 280 | -17 | 1,792 | 3,387 | 89 | 2,131 | 3,667 | 72 |
| Kingston | 216 | 171 | -21 | 763 | 149 | -80 | 979 | 320 | -67 |
| Kitchener – Cambridge – Waterloo | 657 | 290 | -56 | 1,799 | 2,062 | 15 | 2,456 | 2,352 | -4 |
| Lethbridge | 118 | 194 | 64 | 30 | 405 | ## | 148 | 599 | 305 |
| London | 367 | 415 | 13 | 1,367 | 2,587 | 89 | 1,734 | 3,002 | 73 |
| Moncton | 185 | 199 | 8 | 1,130 | 1,983 | 75 | 1,315 | 2,182 | 66 |
| Montréal | 767 | 814 | 6 | 10,110 | 11,675 | 15 | 10,877 | 12,489 | 15 |
| Nanaimo | 141 | 114 | -19 | 208 | 670 | 222 | 349 | 784 | 125 |
| Oshawa | 532 | 338 | -36 | 789 | 1,134 | 44 | 1,321 | 1,472 | 11 |
| Ottawa – Gatineau | 1,351 | 1,325 | -2 | 7,617 | 6,919 | -9 | 8,968 | 8,244 | -8 |
| Gatineau | 250 | 276 | 10 | 2,205 | 2,084 | -5 | 2,455 | 2,360 | -4 |
| Ottawa | 1,101 | 1,049 | -5 | 5,412 | 4,835 | -11 | 6,513 | 5,884 | -10 |
| Peterborough | 84 | 102 | 21 | 27 | 113 | 319 | 111 | 215 | 94 |
| Québec | 447 | 452 | 1 | 3,521 | 4,794 | 36 | 3,968 | 5,246 | 32 |
| Red Deer | 53 | 67 | 26 | 93 | 247 | 166 | 146 | 314 | 115 |
| Regina | 156 | 204 | 31 | 588 | 734 | 25 | 744 | 938 | 26 |
| Saguenay | 154 | 152 | -1 | 429 | 215 | -50 | 583 | 367 | -37 |
| St. Catharines – Niagara | 668 | 517 | -23 | 1,514 | 781 | -48 | 2,182 | 1,298 | -41 |
| Saint John | 163 | 166 | 2 | 264 | 438 | 66 | 427 | 604 | 41 |
| St. John's | 244 | 388 | 59 | 74 | 196 | 165 | 318 | 584 | 84 |
| Saskatoon | 535 | 647 | 21 | 1,396 | 1,228 | -12 | 1,931 | 1,875 | -3 |
| Sherbrooke | 176 | 220 | 25 | 868 | 953 | 10 | 1,044 | 1,173 | 12 |
| Thunder Bay | 76 | 56 | -26 | 133 | 130 | -2 | 209 | 186 | -11 |
| Toronto | 3,539 | 3,389 | -4 | 36,441 | 28,559 | -22 | 39,980 | 31,948 | -20 |
| Trois-Rivières | 134 | 160 | 19 | 771 | 1,269 | 65 | 905 | 1,429 | 58 |
| Vancouver | 2,266 | 1,645 | -27 | 22,951 | 18,858 | -18 | 25,217 | 20,503 | -19 |
| Victoria | 295 | 216 | -27 | 2,858 | 2,850 | 0 | 3,153 | 3,066 | -3 |
| Windsor | 231 | 335 | 45 | 692 | 1,394 | 101 | 923 | 1,729 | 87 |
| Winnipeg | 1,088 | 1,071 | -2 | 3,228 | 2,614 | -19 | 4,316 | 3,685 | -15 |
| Total | 25,070 | 26,431 | 5 | 125,722 | 125,412 | 0 | 150,792 | 151,843 | 1 |
Data for 2021 and 2022 based on 2016 Census Definitions and data for 2023 and 2024 based on 2021 Census Definitions.
Source: CMHC Starts and Completion Survey, Market Absorption Survey
| Single-Detached | All Others | Total | |||||||
|---|---|---|---|---|---|---|---|---|---|
| Sept. 2023 | Sept. 2024 | % | Sept. 2023 | Sept. 2024 | % | Sept. 2023 | Sept. 2024 | % | |
| N.-L. | 67 | 58 | -13 | 26 | 45 | 73 | 93 | 103 | 11 |
| P.E.I. | 8 | 36 | 350 | 10 | 0 | -100 | 18 | 36 | 100 |
| N.S. | 163 | 177 | 9 | 542 | 246 | -55 | 705 | 423 | -40 |
| N.B. | 91 | 107 | 18 | 434 | 539 | 24 | 525 | 646 | 23 |
| Atlantic | 329 | 378 | 15 | 1,012 | 830 | -18 | 1,341 | 1,208 | -10 |
| Qc | 431 | 402 | -7 | 3,924 | 3,554 | -9 | 4,355 | 3,956 | -9 |
| Ont. | 1,341 | 1,477 | 10 | 7,266 | 3,981 | -45 | 8,607 | 5,458 | -37 |
| Man. | 139 | 170 | 22 | 230 | 281 | 22 | 369 | 451 | 22 |
| Sask. | 143 | 147 | 3 | 114 | 359 | 215 | 257 | 506 | 97 |
| Alta. | 1,184 | 1,441 | 22 | 2,921 | 2,325 | -20 | 4,105 | 3,766 | -8 |
| Prairies | 1,466 | 1,758 | 20 | 3,265 | 2,965 | -9 | 4,731 | 4,723 | 0 |
| B.C. | 519 | 420 | -19 | 2,641 | 3,041 | 15 | 3,160 | 3,461 | 10 |
| Canada (10,000+) | 4,086 | 4,435 | 9 | 18,108 | 14,371 | -21 | 22,194 | 18,806 | -15 |
Data for 2023 and 2024 based on 2021 Census Definitions.
Source: CMHC
## not calculable / extreme value
| Single-Detached | All Others | Total | |||||||
|---|---|---|---|---|---|---|---|---|---|
| Sept. 2023 | Sept. 2024 | % | Sept. 2023 | Sept. 2024 | % | Sept. 2023 | Sept. 2024 | % | |
| Abbotsford – Mission | 24 | 26 | 8 | 12 | 247 | ## | 36 | 273 | ## |
| Barrie | 40 | 47 | 18 | 123 | 115 | -7 | 163 | 162 | -1 |
| Belleville – Quinte West | 16 | 38 | 138 | 0 | 11 | ## | 16 | 49 | 206 |
| Brantford | 6 | 37 | ## | 27 | 20 | -26 | 33 | 57 | 73 |
| Calgary | 554 | 660 | 19 | 2,180 | 1,430 | -34 | 2,734 | 2,090 | -24 |
| Chilliwack | 27 | 17 | -37 | 10 | 4 | -60 | 37 | 21 | -43 |
| Drummondville | 8 | 15 | 88 | 42 | 67 | 60 | 50 | 82 | 64 |
| Edmonton | 464 | 637 | 37 | 620 | 798 | 29 | 1,084 | 1,435 | 32 |
| Fredericton | 28 | 37 | 32 | 283 | 26 | -91 | 311 | 63 | -80 |
| Greater / Grand Sudbury | 0 | 18 | ## | 5 | 21 | 320 | 5 | 39 | ## |
| Guelph | 8 | 7 | -13 | 116 | 44 | -62 | 124 | 51 | -59 |
| Halifax | 78 | 64 | -18 | 508 | 166 | -67 | 586 | 230 | -61 |
| Hamilton | 36 | 51 | 42 | 167 | 415 | 149 | 203 | 466 | 130 |
| Kamloops | 47 | 1 | -98 | 78 | 64 | -18 | 125 | 65 | -48 |
| Kelowna | 17 | 34 | 100 | 151 | 425 | 181 | 168 | 459 | 173 |
| Kingston | 38 | 25 | -34 | 44 | 9 | -80 | 82 | 34 | -59 |
| Kitchener – Cambridge – Waterloo | 38 | 22 | -42 | 498 | 119 | -76 | 536 | 141 | -74 |
| Lethbridge | 24 | 22 | -8 | 8 | 0 | -100 | 32 | 22 | -31 |
| London | 52 | 58 | 12 | 127 | 149 | 17 | 179 | 207 | 16 |
| Moncton | 24 | 29 | 21 | 135 | 414 | 207 | 159 | 443 | 179 |
| Montréal | 99 | 108 | 9 | 2,583 | 1,003 | -61 | 2,682 | 1,111 | -59 |
| Nanaimo | 11 | 8 | -27 | 6 | 4 | -33 | 17 | 12 | -29 |
| Oshawa | 86 | 36 | -58 | 10 | 14 | 40 | 96 | 50 | -48 |
| Ottawa – Gatineau | 193 | 216 | 12 | 1,306 | 1,672 | 28 | 1,499 | 1,888 | 26 |
| Gatineau | 48 | 32 | -33 | 219 | 346 | 58 | 267 | 378 | 42 |
| Ottawa | 145 | 184 | 27 | 1,087 | 1,326 | 22 | 1,232 | 1,510 | 23 |
| Peterborough | 11 | 3 | -73 | 0 | 18 | ## | 11 | 21 | 91 |
| Québec | 68 | 49 | -28 | 568 | 547 | -4 | 636 | 596 | -6 |
| Red Deer | 13 | 14 | 8 | 10 | 0 | -100 | 23 | 14 | -39 |
| Regina | 32 | 43 | 34 | 34 | 31 | -9 | 66 | 74 | 12 |
| Saguenay | 18 | 10 | -44 | 15 | 50 | 233 | 33 | 60 | 82 |
| St. Catharines – Niagara | 73 | 60 | -18 | 308 | 10 | -97 | 381 | 70 | -82 |
| Saint John | 24 | 26 | 8 | 5 | 75 | ## | 29 | 101 | 248 |
| St. John's | 42 | 48 | 14 | 20 | 36 | 80 | 62 | 84 | 35 |
| Saskatoon | 105 | 95 | -10 | 20 | 317 | ## | 125 | 412 | 230 |
| Sherbrooke | 25 | 31 | 24 | 84 | 242 | 188 | 109 | 273 | 150 |
| Thunder Bay | 30 | 15 | -50 | 30 | 28 | -7 | 60 | 43 | -28 |
| Toronto | 406 | 554 | 36 | 4,469 | 1,179 | -74 | 4,875 | 1,733 | -64 |
| Trois-Rivières | 16 | 43 | 169 | 85 | 620 | ## | 101 | 663 | ## |
| Vancouver | 251 | 209 | -17 | 1,922 | 1,774 | -8 | 2,173 | 1,983 | -9 |
| Victoria | 41 | 29 | -29 | 175 | 331 | 89 | 216 | 360 | 67 |
| Windsor | 35 | 51 | 46 | 11 | 268 | ## | 46 | 319 | ## |
| Winnipeg | 108 | 139 | 29 | 159 | 139 | -13 | 267 | 278 | 4 |
| Total | 3,216 | 3,632 | 13 | 16,954 | 12,902 | -24 | 20,170 | 16,534 | -18 |
Data for 2023 and 2024 based on 2021 Census Definitions.
Source: CMHC
## not calculable / extreme value
| Single-Detached | All Others | Total | |||||||
|---|---|---|---|---|---|---|---|---|---|
| Aug. 2024 | Sept. 2024 | % | Aug. 2024 | Sept. 2024 | % | Aug. 2024 | Sept. 2024 | % | |
| N.L. | 561 | 553 | -1 | 579 | 405 | -30 | 1,140 | 958 | -16 |
| P.E.I. | 225 | 431 | 92 | 372 | 0 | -100 | 597 | 431 | -28 |
| N.S. | 1,362 | 1,191 | -13 | 1,930 | 2,671 | 38 | 3,292 | 3,862 | 17 |
| N.B. | 838 | 939 | 12 | 7,042 | 6,498 | -8 | 7,880 | 7,437 | -6 |
| Qc | 4,412 | 4,177 | -5 | 36,693 | 35,909 | -2 | 41,105 | 40,086 | -2 |
| Ont. | 13,439 | 15,448 | 15 | 43,933 | 45,740 | 4 | 57,372 | 61,188 | 7 |
| Man. | 1,947 | 1,915 | -2 | 4,956 | 3,372 | -32 | 6,903 | 5,287 | -23 |
| Sask. | 1,293 | 1,475 | 14 | 1,896 | 4,308 | 127 | 3,189 | 5,783 | 81 |
| Alta. | 15,426 | 16,140 | 5 | 30,481 | 28,242 | -7 | 45,907 | 44,382 | -3 |
| B.C. | 4,700 | 4,333 | -8 | 26,950 | 36,255 | 35 | 31,650 | 40,588 | 28 |
| Canada (10,000+) | 44,203 | 46,602 | 5 | 154,832 | 163,400 | 6 | 199,035 | 210,002 | 6 |
| Canada (All Areas) | 51,639 | 54,105 | 5 | 161,373 | 169,707 | 5 | 213,012 | 223,808 | 5 |
Data for 2023 and 2024 based on 2021 Census Definitions.
Source: CMHC
## not calculable / extreme value
| Single-Detached | All Others | Total | |||||||
|---|---|---|---|---|---|---|---|---|---|
| Aug. 2024 | Sept. 2024 | % | Aug. 2024 | Sept. 2024 | % | Aug. 2024 | Sept. 2024 | % | |
| Abbotsford – Mission | 185 | 233 | 26 | 108 | 2,964 | ## | 293 | 3,197 | ## |
| Barrie | 291 | 410 | 41 | 1,704 | 1,380 | -19 | 1,995 | 1,790 | -10 |
| Belleville – Quinte West | 235 | 356 | 51 | 132 | 132 | - | 367 | 488 | 33 |
| Brantford | 129 | 399 | 209 | 0 | 240 | ## | 129 | 639 | 395 |
| Calgary | 6,960 | 7,167 | 3 | 12,936 | 17,160 | 33 | 19,896 | 24,327 | 22 |
| Chilliwack | 192 | 163 | -15 | 192 | 48 | -75 | 252 | 211 | -16 |
| Drummondville | 258 | 245 | -5 | 1,008 | 804 | -20 | 1,266 | 1,049 | -17 |
| Edmonton | 7,029 | 7,385 | 5 | 14,124 | 9,576 | -32 | 21,153 | 16,961 | -20 |
| Fredericton | 264 | 324 | 23 | 1,596 | 312 | -80 | 1,860 | 636 | -66 |
| Greater / Grand Sudbury | -13 | 103 | ## | 0 | 252 | ## | -13 | 355 | ## |
| Guelph | 28 | 88 | 214 | 324 | 528 | 63 | 352 | 616 | 75 |
| Halifax | 974 | 606 | -38 | 1,548 | 1,992 | 29 | 2,522 | 2,598 | 3 |
| Hamilton | 359 | 417 | 16 | 1,068 | 4,980 | 366 | 1,427 | 5,397 | 278 |
| Kamloops | 31 | 11 | -65 | 12 | 768 | ## | 43 | 779 | ## |
| Kelowna | 534 | 519 | -3 | 168 | 5,100 | ## | 702 | 5,619 | ## |
| Kingston | 385 | 215 | -44 | 756 | 108 | -86 | 1,141 | 323 | -72 |
| Kitchener – Cambridge – Waterloo | 289 | 321 | 11 | 3,648 | 1,428 | -61 | 3,937 | 1,749 | -56 |
| Lethbridge | 590 | 247 | -58 | 2,616 | 0 | -100 | 3,206 | 247 | -92 |
| London | 599 | 566 | -6 | 4,944 | 1,788 | -64 | 5,543 | 2,354 | -58 |
| Moncton | 239 | 260 | 9 | 4,896 | 4,968 | 1 | 5,135 | 5,228 | 2 |
| Montréal | 1,255 | 1,171 | -7 | 13,884 | 11,864 | -15 | 15,139 | 13,035 | -14 |
| Nanaimo | 129 | 110 | -15 | 24 | 48 | 100 | 153 | 158 | 3 |
| Oshawa | 404 | 325 | -20 | 2,892 | 168 | -94 | 3,296 | 493 | -85 |
| Ottawa – Gatineau | 1,952 | 1,967 | 1 | 6,984 | 20,064 | 187 | 8,936 | 22,031 | 147 |
| Gatineau | 523 | 287 | -45 | 1,008 | 4,152 | 312 | 1,531 | 4,439 | 190 |
| Ottawa | 1,429 | 1,680 | 18 | 5,976 | 15,912 | 166 | 7,405 | 17,592 | 138 |
| Peterborough | 58 | 51 | -12 | 660 | 216 | -67 | 718 | 267 | -63 |
| Québec | 854 | 660 | -23 | 4,284 | 6,564 | 53 | 5,138 | 7,224 | 41 |
| Red Deer | 74 | 103 | 39 | 0 | 0 | - | 74 | 103 | 39 |
| Regina | 245 | 382 | 56 | 288 | 372 | 29 | 533 | 754 | 41 |
| Saguenay | 79 | 123 | 56 | 360 | 600 | 67 | 439 | 723 | 65 |
| St. Catharines – Niagara | 287 | 676 | 136 | 2,028 | 120 | -94 | 2,315 | 796 | -66 |
| Saint John | 251 | 224 | -11 | 288 | 900 | 213 | 539 | 1,124 | 109 |
| St. John's | 539 | 491 | -9 | 516 | 432 | -16 | 1,055 | 923 | -13 |
| Saskatoon | 944 | 963 | 2 | 1,476 | 3,804 | 158 | 2,420 | 4,767 | 97 |
| Sherbrooke | 327 | 318 | -3 | 1,116 | 2,904 | 160 | 1,443 | 3,222 | 123 |
| Thunder Bay | 54 | 62 | 15 | 0 | 336 | ## | 54 | 398 | ## |
| Toronto | 5,304 | 6,384 | 20 | 19,428 | 14,148 | -27 | 24,732 | 20,532 | -17 |
| Trois-Rivières | 351 | 426 | 21 | 1,500 | 7,440 | 396 | 1,851 | 7,866 | 325 |
| Vancouver | 2,054 | 2,175 | 6 | 18,408 | 21,288 | 16 | 20,462 | 23,463 | 15 |
| Victoria | 249 | 285 | 14 | 5,124 | 3,972 | -22 | 5,373 | 4,257 | -21 |
| Windsor | 508 | 495 | -3 | 1,128 | 3,216 | 185 | 1,636 | 3,711 | 127 |
| Winnipeg | 1,613 | 1,614 | 0 | 3,876 | 1,668 | -57 | 5,489 | 3,282 | -40 |
Data for 2023 and 2024 based on 2021 Census Definitions.
Source: CMHC
## not calculable / extreme value
