


 Share via Email
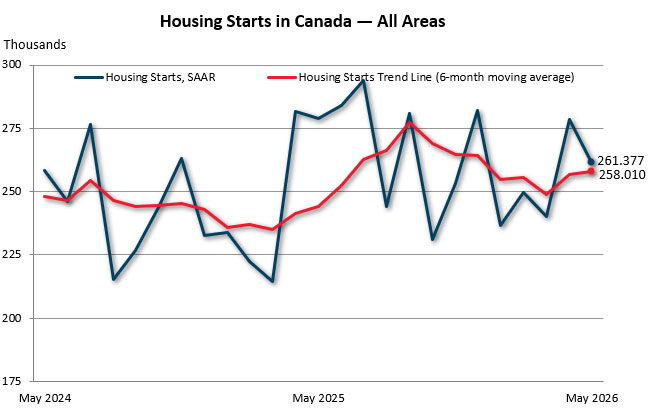
The six-month trend in housing starts was virtually flat in May, with a slight increase of 0.5% to 258,010 units, according to Canada Mortgage and Housing Corporation (CMHC). The trend measure is a six-month moving average of the seasonally adjusted annual rate (SAAR) of total housing starts for all areas in Canada.
Actual monthly housing starts were down 5.2% year-over-year in centres with a population of 10,000 or more, with 22,633 units recorded in May, compared to 23,879 units in May 2025. The year-to-date total was 93,644 units, up 3% from the same period in 2025, driven by higher starts in British Columbia and Ontario, outweighing year-over-year decreases in the Prairies.
The total monthly SAAR of housing starts for all areas in Canada decreased 6% in May (261,377 units) compared to April (278,380 units).
The number of units under construction in centres with a population of 50,000 or more rose 0.9% month-over-month to 374,662 units in May. Completions also increased, with construction finished on 16,880 units, up 10.6% compared to April. The number of units with approved building permits but not yet started fell 2.4% month-over-month to 138,842 units in May.
Quote:
“May’s data showed mixed results. Year-to-date housing starts are slightly up from last year, and the monthly starts trend was basically flat, while units under construction and completions increased. Overall, these results suggest that construction activity is uneven and taken together with the decline of approved units not yet started and market intelligence point to weaker momentum for future supply,” said Aled Ab Iorwerth, Deputy Chief Economist at CMHC.
Key facts:
- The rural starts monthly SAAR estimate was 14,357 units.
- Among Canada’s three biggest CMAs, Montreal posted a 18% year-over-year increase in actual housing starts this month driven by higher multi-unit. Vancouver recorded a 7% decrease due to lower multi-unit starts while Toronto starts decreased 12%.
- Read more about why housing starts matter on CMHC’s Housing Observer.
- Monthly Housing Starts and Other Construction Data are accessible in English and French on our website and the CMHC Housing Market Information Portal.
- Housing starts data is available on the eleventh business day each month. We will release the June housing starts data on July 16 at 8:15 AM ET.
- CMHC uses the trend measure as a complement to the monthly SAAR of housing starts to account for considerable swings in monthly estimates and to obtain a clearer picture of upcoming new housing supply. In some situations, analyzing only SAAR data can be misleading, as the multi-unit segment largely drives the market and can vary significantly from one month to the next.
- Read about CMHC's definitions and methodology to better understand the foundations of the Starts and Completions and Market Absorption surveys.
Housing starts facilitate the analysis of monthly, quarterly, and year-over-year activity in the new home market. The data CMHC collects as part of the Starts and Completions and Market Absorption surveys helps us obtain a clearer picture of upcoming new housing supply and is used as part of our various housing reports.
For 80 years, CMHC has been the foundation of Canada's housing system, promoting stability and sustainability. CMHC's mortgage insurance products support access to home ownership and the creation and maintenance of rental supply. CMHC research and data help inform housing policy. By facilitating cooperation between all levels of government, private and non-profit sectors, CMHC contributes to advancing housing affordability, equity, and climate compatibility. CMHC actively supports the Government of Canada in delivering on its commitment to make housing more affordable.
Follow us on X, YouTube, LinkedIn, Facebook and Instagram.
Related links:
- Housing starts for April 2026
- 2026 Mid-Year Rental Market Update | CMHC
- Supplying smarter: Learning to make housing supply more responsive | CMHC
- Development charges: cities aren’t created equally | CMHC
- Spring 2026 Housing Supply Report
Information on this release:
To request an interview with a CMHC economist, contact:
Media Relations, CMHC
media@cmhc-schl.gc.ca
| Approved Units* Awaiting Housing Start | Under Construction (Units) | Completions (Units) | |||||||
|---|---|---|---|---|---|---|---|---|---|
| Apr. 2026 | May 2026 | % | Apr. 2026 | May 2026 | % | Apr. 2026 | May 2026 | % | |
| N.L. | 413 | 331 | -19.9 | 851 | 836 | -1.8 | 119 | 97 | -18.5 |
| P.E.I. | 294 | 351 | 19.4 | 879 | 999 | 13.7 | 37 | 65 | 75.7 |
| N.S. | 3,858 | 3,061 | -20.7 | 13,694 | 14,388 | 5.1 | 157 | 102 | -35 |
| N.B. | 1,378 | 1,168 | -15.2 | 5,877 | 5,854 | -0.4 | 472 | 438 | -7.2 |
| Atlantic | 5,943 | 4,911 | -17.4 | 21,301 | 22,077 | 3.6 | 785 | 702 | -10.6 |
| Que. | 34,533 | 33,570 | -2.8 | 58,963 | 60,626 | 2.8 | 2,764 | 3,371 | 22 |
| Ont. | 29,408 | 28,558 | -2.9 | 149,423 | 150,477 | 0.7 | 4,028 | 4,133 | 2.6 |
| Man. | 4,248 | 4,175 | -1.7 | 9,161 | 9,646 | 5.3 | 195 | 200 | 2.6 |
| Sask. | 2,068 | 1,894 | -8.4 | 5,823 | 6,271 | 7.7 | 549 | 248 | -54.8 |
| Alta. | 24,139 | 23,799 | -1.4 | 43,156 | 43,793 | 1.5 | 3,535 | 4,065 | 15 |
| Prairies | 30,455 | 29,868 | -1.9 | 58,140 | 59,710 | 2.7 | 4,279 | 4,513 | 5.5 |
| B.C. | 41,985 | 41,935 | -0.1 | 83,364 | 81,772 | -1.9 | 3,401 | 4,161 | 22.3 |
| Canada 50,000+ | 142,324 | 138,842 | -2.4 | 371,191 | 374,662 | 0.9 | 15,257 | 16,880 | 10.6 |
*Units with approved building permits (excluding conversions) that have not yet begun construction and are not yet counted as housing starts. These units, where no construction activity has yet been observed through CMHC’s Starts and Completions Survey (SCS), may be indicative of future housing starts.
## not calculable / extreme value
Source: CMHC Starts and Completions Survey (SCS)
© 2026 Canada Mortgage and Housing Corporation
| Approved Units* Awaiting Housing Start | Under Construction (Units) | Completions (Units) | |||||||
|---|---|---|---|---|---|---|---|---|---|
| Apr. 2026 | May 2026 | % | Apr. 2026 | May 2026 | % | Apr. 2026 | May 2026 | % | |
| Abbotsford – Mission | 2,373 | 2,042 | -13.9 | 2,766 | 3,044 | 10.1 | 186 | 189 | 1.6 |
| Barrie | 644 | 633 | -1.7 | 2,030 | 2,155 | 6.2 | 52 | 15 | -71.2 |
| Belleville – Quinte West | 147 | 150 | 2 | 819 | 817 | -0.2 | 17 | 17 | 0 |
| Brantford | 410 | 389 | -5.1 | 1,858 | 1,985 | 6.8 | 44 | 54 | 22.7 |
| Calgary | 18,779 | 17,849 | -5 | 24,095 | 24,375 | 1.2 | 2,097 | 2,432 | 16 |
| Chilliwack | 150 | 151 | 0.7 | 1,209 | 1,220 | 0.9 | 137 | 8 | -94.2 |
| Drummondville | 292 | 240 | -17.8 | 1,032 | 1,022 | -1 | 89 | 122 | 37.1 |
| Edmonton | 4,838 | 5,240 | 8.3 | 16,924 | 17,440 | 3 | 1,362 | 1,413 | 3.7 |
| Fredericton | 287 | 162 | -43.6 | 1,440 | 1,403 | -2.6 | 266 | 162 | -39.1 |
| Greater / Grand Sudbury | 49 | 40 | -18.4 | 572 | 537 | -6.1 | 50 | 50 | 0 |
| Guelph | 111 | 115 | 3.6 | 545 | 423 | -22.4 | 62 | 128 | 106.5 |
| Halifax | 3,750 | 2,992 | -20.2 | 13,549 | 14,224 | 5 | 127 | 84 | -33.9 |
| Hamilton | 376 | 513 | 36.4 | 6,994 | 6,960 | -0.5 | 452 | 42 | -90.7 |
| Kamloops | 333 | 421 | 26.4 | 1,252 | 1,275 | 1.8 | 28 | 33 | 17.9 |
| Kelowna | 1,376 | 1,184 | -14 | 4,442 | 4,488 | 1 | 537 | 198 | -63.1 |
| Kingston | 619 | 402 | -35.1 | 1,835 | 2,039 | 11.1 | 12 | 13 | 8.3 |
| Kitchener – Cambridge – Waterloo | 780 | 619 | -20.6 | 7,997 | 8,002 | 0.1 | 253 | 264 | 4.3 |
| Lethbridge | 360 | 492 | 36.7 | 836 | 796 | -4.8 | 33 | 60 | 81.8 |
| London | 1,616 | 1,684 | 4.2 | 6,738 | 6,763 | 0.4 | 64 | 99 | 54.7 |
| Moncton | 603 | 550 | -8.8 | 3,467 | 3,461 | -0.2 | 171 | 238 | 39.2 |
| Montréal | 20,546 | 20,027 | -2.5 | 34,410 | 35,838 | 4.1 | 1,537 | 1,750 | 13.9 |
| Nanaimo | 258 | 314 | 21.7 | 1,126 | 1,136 | 0.9 | 28 | 13 | -53.6 |
| Oshawa | 755 | 822 | 8.9 | 2,760 | 2,746 | -0.5 | 614 | 54 | -91.2 |
| Ottawa – Gatineau | 6,011 | 6,295 | 4.7 | 21,555 | 21,418 | -0.6 | 975 | 1,124 | 15.3 |
| Gatineau | 2,090 | 1,842 | -11.9 | 4,229 | 4,206 | -0.5 | 138 | 360 | 160.9 |
| Ottawa | 3,921 | 4,453 | 13.6 | 17,326 | 17,212 | -0.7 | 837 | 764 | -8.7 |
| Peterborough | 122 | 127 | 4.1 | 62 | 64 | 3.2 | 9 | 3 | -66.7 |
| Québec | 7,891 | 7,328 | -7.1 | 10,844 | 11,201 | 3.3 | 426 | 684 | 60.6 |
| Red Deer | 40 | 43 | 7.5 | 422 | 296 | -29.9 | 21 | 151 | ## |
| Regina | 181 | 331 | 82.9 | 1,781 | 1,830 | 2.8 | 81 | 38 | -53.1 |
| Saguenay | 817 | 930 | 13.8 | 1,045 | 924 | -11.6 | 88 | 30 | -65.9 |
| St. Catharines – Niagara | 830 | 1,219 | 46.9 | 4,350 | 4,391 | 0.9 | 47 | 124 | 163.8 |
| Saint John | 488 | 456 | -6.6 | 970 | 990 | 2.1 | 35 | 38 | 8.6 |
| St. John's | 413 | 331 | -19.9 | 851 | 836 | -1.8 | 119 | 97 | -18.5 |
| Saskatoon | 1,887 | 1,563 | -17.2 | 4,042 | 4,441 | 9.9 | 468 | 210 | -55.1 |
| Sherbrooke | 449 | 610 | 35.9 | 2,040 | 2,094 | 2.6 | 206 | 93 | -54.9 |
| Thunder Bay | 192 | 154 | -19.8 | 359 | 441 | 22.8 | 13 | 5 | -61.5 |
| Toronto | 17,732 | 16,195 | -8.7 | 90,550 | 91,382 | 0.9 | 1,376 | 2,224 | 61.6 |
| Trois-Rivières | 656 | 767 | 16.9 | 1,012 | 995 | -1.7 | 17 | 131 | ## |
| Vancouver | 35,830 | 36,118 | 0.8 | 61,945 | 60,059 | -3 | 2,345 | 3,354 | 43 |
| Victoria | 1,492 | 1,538 | 3.1 | 9,262 | 9,148 | -1.2 | 48 | 347 | ## |
| Windsor | 265 | 274 | 3.4 | 1,598 | 1,654 | 3.5 | 75 | 32 | -57.3 |
| Winnipeg | 4,142 | 4,084 | -1.4 | 8,773 | 9,246 | 5.4 | 188 | 195 | 3.7 |
| CMA Total | 138,890 | 135,394 | -2.5 | 360,157 | 363,559 | 0.9 | 14,755 | 16,318 | 10.6 |
*Units with approved building permits (excluding conversions) that have not yet begun construction and are not yet counted as housing starts. These units, where no construction activity has yet been observed through CMHC’s Starts and Completions Survey (SCS), may be indicative of future housing starts.
## not calculable / extreme value
Source: CMHC Starts and Completions Survey (SCS)
© 2026 Canada Mortgage and Housing Corporation
| Single-Detached | All Others | Total | |||||||
|---|---|---|---|---|---|---|---|---|---|
| Apr. 2026 | May 2026 | % | Apr. 2026 | May 2026 | % | Apr. 2026 | May 2026 | % | |
| N.L. | 704 | 672 | -5 | 763 | 688 | -10 | 1,466 | 1,360 | -7 |
| P.E.I. | 270 | 289 | 7 | 976 | 1,232 | 26 | 1,246 | 1,521 | 22 |
| N.S. | 1,456 | 1,447 | -1 | 5,163 | 5,862 | 14 | 6,619 | 7,308 | 10 |
| N.B. | 1,073 | 1,011 | -6 | 4,648 | 3,537 | -24 | 5,721 | 4,548 | -21 |
| Que. | 5,391 | 5,509 | 2 | 55,348 | 54,232 | -2 | 60,739 | 59,741 | -2 |
| Ont. | 9,583 | 9,465 | -1 | 59,820 | 62,070 | 4 | 69,403 | 71,535 | 3 |
| Man. | 2,141 | 2,208 | 3 | 5,808 | 4,944 | -15 | 7,949 | 7,152 | -10 |
| Sask. | 1,875 | 1,951 | 4 | 2,520 | 3,308 | 31 | 4,395 | 5,259 | 20 |
| Alta. | 13,135 | 13,429 | 2 | 29,703 | 30,204 | 2 | 42,839 | 43,632 | 2 |
| B.C. | 4,142 | 4,077 | -2 | 39,558 | 39,033 | -1 | 43,700 | 43,110 | -1 |
| Canada (10,000+) | 39,770 | 40,059 | 1 | 204,306 | 205,109 | 0 | 244,077 | 245,168 | 0 |
| Canada (All Areas) | 46,019 | 46,285 | 1 | 210,627 | 211,725 | 1 | 256,646 | 258,010 | 1 |
Data based on 2021 Census Definitions.
Source: Market Analysis Centre, CMHC
| Single-Detached | All Others | Total | |||||||
|---|---|---|---|---|---|---|---|---|---|
| Apr. 2026 | May 2026 | % | Apr. 2026 | May 2026 | % | Apr. 2026 | May 2026 | % | |
| Abbotsford – Mission | 186 | 164 | -12 | 548 | 1,402 | 156 | 734 | 1,566 | 113 |
| Barrie | 209 | 132 | -37 | 202 | 374 | 85 | 411 | 506 | 23 |
| Belleville – Quinte West | 126 | 131 | 4 | 184 | 144 | -22 | 310 | 275 | -11 |
| Brantford | 305 | 257 | -16 | 840 | 1,136 | 35 | 1,144 | 1,393 | 22 |
| Calgary | 5,825 | 5,813 | 0 | 14,650 | 15,134 | 3 | 20,475 | 20,947 | 2 |
| Chilliwack | 124 | 118 | -5 | 850 | 762 | -10 | 974 | 880 | -10 |
| Drummondville | 229 | 227 | -1 | 1,428 | 1,254 | -12 | 1,657 | 1,481 | -11 |
| Edmonton | 5,526 | 5,822 | 5 | 12,198 | 12,330 | 1 | 17,724 | 18,152 | 2 |
| Fredericton | 282 | 245 | -13 | 674 | 436 | -35 | 956 | 681 | -29 |
| Greater / Grand Sudbury | 87 | 92 | 6 | 338 | 142 | -58 | 425 | 234 | -45 |
| Guelph | 32 | 29 | -9 | 416 | 404 | -3 | 448 | 433 | -3 |
| Halifax | 686 | 699 | 2 | 3,826 | 4,552 | 19 | 4,512 | 5,251 | 16 |
| Hamilton | 303 | 240 | -21 | 3,162 | 3,094 | -2 | 3,465 | 3,334 | -4 |
| Kamloops | 132 | 123 | -7 | 1,682 | 1,730 | 3 | 1,814 | 1,853 | 2 |
| Kelowna | 224 | 216 | -4 | 1,780 | 1,844 | 4 | 2,004 | 2,060 | 3 |
| Kingston | 240 | 164 | -32 | 200 | 614 | 207 | 440 | 778 | 77 |
| Kitchener – Cambridge – Waterloo | 389 | 387 | -1 | 5,236 | 5,620 | 7 | 5,625 | 6,007 | 7 |
| Lethbridge | 320 | 312 | -3 | 490 | 490 | - | 810 | 802 | -1 |
| London | 419 | 448 | 7 | 4,630 | 4,206 | -9 | 5,049 | 4,654 | -8 |
| Moncton | 372 | 345 | -7 | 2,420 | 1,967 | -19 | 2,792 | 2,312 | -17 |
| Montréal | 1,356 | 1,368 | 1 | 24,700 | 24,388 | -1 | 26,055 | 25,757 | -1 |
| Nanaimo | 117 | 110 | -6 | 634 | 604 | -5 | 751 | 714 | -5 |
| Oshawa | 494 | 499 | 1 | 342 | 174 | -49 | 836 | 673 | -19 |
| Ottawa – Gatineau | 1,977 | 2,065 | 4 | 13,393 | 13,318 | -1 | 15,370 | 15,383 | 0 |
| Gatineau | 390 | 411 | 5 | 2,457 | 3,058 | 24 | 2,848 | 3,469 | 22 |
| Ottawa | 1,587 | 1,654 | 4 | 10,936 | 10,260 | -6 | 12,522 | 11,914 | -5 |
| Peterborough | 66 | 71 | 8 | 22 | 22 | - | 88 | 93 | 6 |
| Québec | 742 | 736 | -1 | 6,506 | 7,048 | 8 | 7,248 | 7,784 | 7 |
| Red Deer | 82 | 108 | 32 | 358 | 366 | 2 | 439 | 474 | 8 |
| Regina | 496 | 485 | -2 | 1,022 | 1,062 | 4 | 1,517 | 1,547 | 2 |
| Saguenay | 239 | 226 | -5 | 1,134 | 1,084 | -4 | 1,373 | 1,310 | -5 |
| St. Catharines – Niagara | 580 | 550 | -5 | 3,014 | 2,886 | -4 | 3,594 | 3,436 | -4 |
| Saint John | 265 | 284 | 7 | 370 | 192 | -48 | 635 | 476 | -25 |
| St. John's | 561 | 535 | -5 | 612 | 536 | -12 | 1,173 | 1,071 | -9 |
| Saskatoon | 1,358 | 1,447 | 7 | 1,472 | 2,214 | 50 | 2,830 | 3,661 | 29 |
| Sherbrooke | 218 | 265 | 22 | 2,532 | 2,190 | -14 | 2,750 | 2,455 | -11 |
| Thunder Bay | 91 | 90 | -1 | 214 | 366 | 71 | 305 | 456 | 50 |
| Toronto | 2,352 | 2,363 | 0 | 22,848 | 25,220 | 10 | 25,200 | 27,583 | 9 |
| Trois-Rivières | 156 | 138 | -12 | 832 | 828 | 0 | 988 | 966 | -2 |
| Vancouver | 2,101 | 2,126 | 1 | 26,296 | 24,794 | -6 | 28,397 | 26,920 | -5 |
| Victoria | 317 | 298 | -6 | 4,274 | 4,218 | -1 | 4,591 | 4,516 | -2 |
| Windsor | 289 | 309 | 7 | 990 | 684 | -31 | 1,279 | 993 | -22 |
| Winnipeg | 1,846 | 1,931 | 5 | 4,964 | 4,282 | -14 | 6,810 | 6,212 | -9 |
Data based on 2021 Census Definitions.
Source: Market Analysis Centre, CMHC
| Single-Detached | All Others | Total | |||||||
|---|---|---|---|---|---|---|---|---|---|
| 2025 | 2026 | % | 2025 | 2026 | % | 2025 | 2026 | % | |
| N.L. | 193 | 179 | -7 | 140 | 283 | 102 | 333 | 462 | 39 |
| P.E.I. | 99 | 86 | -13 | 417 | 555 | 33 | 516 | 641 | 24 |
| N.S. | 480 | 455 | -5 | 2,752 | 2,156 | -22 | 3,232 | 2,611 | -19 |
| N.B. | 203 | 213 | 5 | 1,216 | 1,210 | 0 | 1,419 | 1,423 | 0 |
| Atlantic | 975 | 933 | -4 | 4,525 | 4,204 | -7 | 5,500 | 5,137 | -7 |
| Que. | 1,574 | 1,882 | 20 | 19,423 | 20,243 | 4 | 20,997 | 22,125 | 5 |
| Ont. | 3,258 | 3,105 | -5 | 18,880 | 22,979 | 22 | 22,138 | 26,084 | 18 |
| Man. | 870 | 849 | -2 | 1,684 | 2,340 | 39 | 2,554 | 3,189 | 25 |
| Sask. | 634 | 646 | 2 | 1,766 | 1,397 | -21 | 2,400 | 2,043 | -15 |
| Alta. | 6,363 | 5,111 | -20 | 16,175 | 12,672 | -22 | 22,538 | 17,783 | -21 |
| Prairies | 7,867 | 6,606 | -16 | 19,625 | 16,409 | -16 | 27,492 | 23,015 | -16 |
| B.C. | 1,467 | 1,432 | -2 | 13,525 | 15,851 | 17 | 14,992 | 17,283 | 15 |
| Canada | 15,141 | 13,958 | -8 | 75,978 | 79,686 | 5 | 91,119 | 93,644 | 3 |
1 Data for 2024, 2025 and 2026 based on 2021 Census Definitions.
Source: CMHC Starts and Completion Survey, Market Absorption Survey
| Single-Detached | All Others | Total | |||||||
|---|---|---|---|---|---|---|---|---|---|
| 2025 | 2026 | % | 2025 | 2026 | % | 2025 | 2026 | % | |
| Abbotsford – Mission | 58 | 50 | -14 | 902 | 680 | -25 | 960 | 730 | -24 |
| Barrie | 45 | 48 | 7 | 121 | 184 | 52 | 166 | 232 | 40 |
| Belleville – Quinte West | 43 | 34 | -21 | 165 | 5 | -97 | 208 | 39 | -81 |
| Brantford | 104 | 113 | 9 | 933 | 568 | -39 | 1,037 | 681 | -34 |
| Calgary | 2,969 | 2,299 | -23 | 9,443 | 6,682 | -29 | 12,412 | 8,981 | -28 |
| Chilliwack | 54 | 47 | -13 | 241 | 348 | 44 | 295 | 395 | 34 |
| Drummondville | 91 | 93 | 2 | 337 | 490 | 45 | 428 | 583 | 36 |
| Edmonton | 2,798 | 2,196 | -22 | 5,381 | 4,852 | -10 | 8,179 | 7,048 | -14 |
| Fredericton | 46 | 44 | -4 | 234 | 199 | -15 | 280 | 243 | -13 |
| Greater/Grand Sudbury | 15 | 23 | 53 | 74 | 48 | -35 | 89 | 71 | -20 |
| Guelph | 8 | 3 | -63 | 25 | 52 | 108 | 33 | 55 | 67 |
| Halifax | 266 | 232 | -13 | 2,555 | 1,626 | -36 | 2,821 | 1,858 | -34 |
| Hamilton | 74 | 63 | -15 | 691 | 670 | -3 | 765 | 733 | -4 |
| Kamloops | 46 | 52 | 13 | 110 | 844 | ## | 156 | 896 | ## |
| Kelowna | 105 | 67 | -36 | 1,047 | 869 | -17 | 1,152 | 936 | -19 |
| Kingston | 62 | 53 | -15 | 218 | 223 | 2 | 280 | 276 | -1 |
| Kitchener – Cambridge – Waterloo | 116 | 128 | 10 | 1,055 | 2,284 | 116 | 1,171 | 2,412 | 106 |
| Lethbridge | 124 | 83 | -33 | 180 | 199 | 11 | 304 | 282 | -7 |
| London | 169 | 151 | -11 | 251 | 1,945 | ## | 420 | 2,096 | ## |
| Moncton | 66 | 62 | -6 | 809 | 854 | 6 | 875 | 916 | 5 |
| Montréal | 468 | 465 | -1 | 9,495 | 9,937 | 5 | 9,963 | 10,402 | 4 |
| Nanaimo | 33 | 50 | 52 | 123 | 298 | 142 | 156 | 348 | 123 |
| Oshawa | 105 | 95 | -10 | 146 | 64 | -56 | 251 | 159 | -37 |
| Ottawa – Gatineau | 635 | 732 | 15 | 4,604 | 4,569 | -1 | 5,239 | 5,301 | 1 |
| Gatineau | 97 | 145 | 49 | 1,015 | 1,428 | 41 | 1,112 | 1,573 | 41 |
| Ottawa | 538 | 587 | 9 | 3,589 | 3,141 | -12 | 4,127 | 3,728 | -10 |
| Peterborough | 22 | 18 | -18 | 3 | 11 | ## | 25 | 29 | 16 |
| Québec | 286 | 310 | 8 | 3,924 | 3,395 | -13 | 4,210 | 3,705 | -12 |
| Red Deer | 48 | 42 | -13 | 197 | 163 | -17 | 245 | 205 | -16 |
| Regina | 131 | 143 | 9 | 721 | 517 | -28 | 852 | 660 | -23 |
| Saguenay | 84 | 80 | -5 | 201 | 411 | 104 | 285 | 491 | 72 |
| St. Catharines – Niagara | 160 | 193 | 21 | 468 | 868 | 85 | 628 | 1,061 | 69 |
| Saint John | 54 | 71 | 31 | 77 | 53 | -31 | 131 | 124 | -5 |
| St. John's | 183 | 154 | -16 | 135 | 243 | 80 | 318 | 397 | 25 |
| Saskatoon | 471 | 489 | 4 | 968 | 866 | -11 | 1,439 | 1,355 | -6 |
| Sherbrooke | 91 | 99 | 9 | 435 | 900 | 107 | 526 | 999 | 90 |
| Thunder Bay | 14 | 12 | -14 | 31 | 183 | ## | 45 | 195 | ## |
| Toronto | 1,105 | 774 | -30 | 9,769 | 10,319 | 6 | 10,874 | 11,093 | 2 |
| Trois-Rivières | 71 | 46 | -35 | 539 | 363 | -33 | 610 | 409 | -33 |
| Vancouver | 754 | 758 | 1 | 8,938 | 9,755 | 9 | 9,692 | 10,513 | 8 |
| Victoria | 83 | 98 | 18 | 1,296 | 1,691 | 30 | 1,379 | 1,789 | 30 |
| Windsor | 108 | 95 | -12 | 139 | 263 | 89 | 247 | 358 | 45 |
| Winnipeg | 794 | 770 | -3 | 1,481 | 2,074 | 40 | 2,275 | 2,844 | 25 |
| Total | 12,959 | 11,335 | -13 | 68,462 | 70,565 | 3 | 81,421 | 81,900 | 1 |
1 Data for 2024, 2025 and 2026 based on 2021 Census Definitions.
Source: CMHC Starts and Completion Survey, Market Absorption Survey
| Single-Detached | All Others | Total | |||||||
|---|---|---|---|---|---|---|---|---|---|
| May 2025 | May 2026 | % | May 025 | May 2026 | % | May 2025 | May 2026 | % | |
| N.-L. | 67 | 66 | -1 | 33 | 26 | -21 | 100 | 92 | -8 |
| P.E.I. | 31 | 41 | 32 | 20 | 144 | ## | 51 | 185 | ## |
| N.S. | 130 | 125 | -4 | 579 | 824 | 42 | 709 | 949 | 34 |
| N.B. | 88 | 94 | 7 | 474 | 359 | -24 | 562 | 453 | -19 |
| Atlantic | 316 | 326 | 3 | 1,106 | 1,353 | 22 | 1,422 | 1,679 | 18 |
| Que. | 445 | 558 | 25 | 6,127 | 5,417 | -12 | 6,572 | 5,975 | -9 |
| Ont. | 874 | 880 | 1 | 4,992 | 4,781 | -4 | 5,866 | 5,661 | -3 |
| Man. | 186 | 206 | 11 | 511 | 514 | 1 | 697 | 720 | 3 |
| Sask. | 182 | 211 | 16 | 288 | 496 | 72 | 470 | 707 | 50 |
| Alta. | 1,496 | 1,336 | -11 | 4,278 | 3,585 | -16 | 5,774 | 4,921 | -15 |
| Prairies | 1,864 | 1,753 | -6 | 5,077 | 4,595 | -9 | 6,941 | 6,348 | -9 |
| B.C. | 352 | 346 | -2 | 2,726 | 2,624 | -4 | 3,078 | 2,970 | -4 |
| Canada (10,000+) | 3,851 | 3,863 | 0 | 20,028 | 18,770 | -6 | 23,879 | 22,633 | -5 |
Data for 2022 based on 2016 Census Definitions and data for 2023, 2024 and 2025 based on 2021 Census Definitions.
Source: CMHC Starts and Completion Survey, Market Absorption Survey
## not calculable / extreme value
| Single-Detached | All Others | Total | |||||||
|---|---|---|---|---|---|---|---|---|---|
| May 2025 | May 2026 | % | May 2025 | May 2026 | % | May 2025 | May 2026 | % | |
| Abbotsford – Mission | 18 | 13 | -28 | 45 | 454 | ## | 63 | 467 | ## |
| Barrie | 24 | 4 | -83 | 23 | 136 | ## | 47 | 140 | 198 |
| Belleville – Quinte West | 11 | 14 | 27 | 0 | 1 | ## | 11 | 15 | 36 |
| Brantford | 16 | 12 | -25 | 353 | 169 | -52 | 369 | 181 | -51 |
| Calgary | 641 | 541 | -16 | 2,398 | 2,178 | -9 | 3,039 | 2,719 | -11 |
| Chilliwack | 16 | 12 | -25 | 4 | 7 | 75 | 20 | 19 | -5 |
| Drummondville | 19 | 29 | 53 | 83 | 86 | 4 | 102 | 115 | 13 |
| Edmonton | 706 | 648 | -8 | 1,517 | 1,294 | -15 | 2,223 | 1,942 | -13 |
| Fredericton | 21 | 21 | - | 109 | 105 | -4 | 130 | 126 | -3 |
| Greater / Grand Sudbury | 7 | 10 | 43 | 69 | 6 | -91 | 76 | 16 | -79 |
| Guelph | 1 | 0 | -100 | 18 | 6 | -67 | 19 | 6 | -68 |
| Halifax | 56 | 66 | 18 | 488 | 693 | 42 | 544 | 759 | 40 |
| Hamilton | 19 | 8 | -58 | 66 | 0 | -100 | 85 | 8 | -91 |
| Kamloops | 5 | 6 | 20 | 4 | 50 | ## | 9 | 56 | ## |
| Kelowna | 33 | 23 | -30 | 379 | 221 | -42 | 412 | 244 | -41 |
| Kingston | 15 | 6 | -60 | 2 | 211 | ## | 17 | 217 | ## |
| Kitchener – Cambridge – Waterloo | 20 | 23 | 15 | 37 | 246 | ## | 57 | 269 | ## |
| Lethbridge | 42 | 18 | -57 | 38 | 2 | -95 | 80 | 20 | -75 |
| London | 27 | 44 | 63 | 26 | 87 | ## | 53 | 131 | 147 |
| Moncton | 36 | 27 | -25 | 262 | 201 | -23 | 298 | 228 | -23 |
| Montréal | 121 | 164 | 36 | 2,556 | 3,003 | 17 | 2,677 | 3,167 | 18 |
| Nanaimo | 4 | 7 | 75 | 18 | 16 | -11 | 22 | 23 | 5 |
| Oshawa | 41 | 27 | -34 | 44 | 13 | -70 | 85 | 40 | -53 |
| Ottawa – Gatineau | 113 | 263 | 133 | 933 | 816 | -13 | 1,046 | 1,079 | 3 |
| Gatineau | 30 | 59 | 97 | 389 | 366 | -6 | 419 | 425 | 1 |
| Ottawa | 83 | 204 | 146 | 544 | 450 | -17 | 627 | 654 | 4 |
| Peterborough | 4 | 5 | 25 | 0 | 0 | - | 4 | 5 | 25 |
| Québec | 93 | 95 | 2 | 1,952 | 946 | -52 | 2,045 | 1,041 | -49 |
| Red Deer | 8 | 16 | 100 | 180 | 17 | -91 | 188 | 33 | -82 |
| Regina | 32 | 29 | -9 | 28 | 60 | 114 | 60 | 89 | 48 |
| Saguenay | 26 | 15 | -42 | 50 | 36 | -28 | 76 | 51 | -33 |
| St. Catharines – Niagara | 60 | 29 | -52 | 78 | 139 | 78 | 138 | 168 | 22 |
| Saint John | 20 | 33 | 65 | 50 | 25 | -50 | 70 | 58 | -17 |
| St. John's | 62 | 60 | -3 | 30 | 25 | -17 | 92 | 85 | -8 |
| Saskatoon | 145 | 175 | 21 | 249 | 432 | 73 | 394 | 607 | 54 |
| Sherbrooke | 21 | 43 | 105 | 55 | 103 | 87 | 76 | 146 | 92 |
| Thunder Bay | 9 | 5 | -44 | 11 | 82 | ## | 20 | 87 | ## |
| Toronto | 310 | 241 | -22 | 3,202 | 2,883 | -10 | 3,512 | 3,124 | -11 |
| Trois-Rivières | 21 | 16 | -24 | 313 | 98 | -69 | 334 | 114 | -66 |
| Vancouver | 180 | 190 | 6 | 1,593 | 1,459 | -8 | 1,773 | 1,649 | -7 |
| Victoria | 14 | 20 | 43 | 362 | 213 | -41 | 376 | 233 | -38 |
| Windsor | 33 | 40 | 21 | 31 | 46 | 48 | 64 | 86 | 34 |
| Winnipeg | 174 | 187 | 7 | 499 | 481 | -4 | 673 | 668 | -1 |
| Total | 3,224 | 3,185 | -1 | 18,155 | 17,046 | -6 | 21,379 | 20,231 | -5 |
Data for 2022 based on 2016 Census Definitions and data for 2023, 2024 and 2025 based on 2021 Census Definitions.
Source: CMHC Starts and Completion Survey, Market Absorption Survey
## not calculable / extreme value
