


 Share via Email
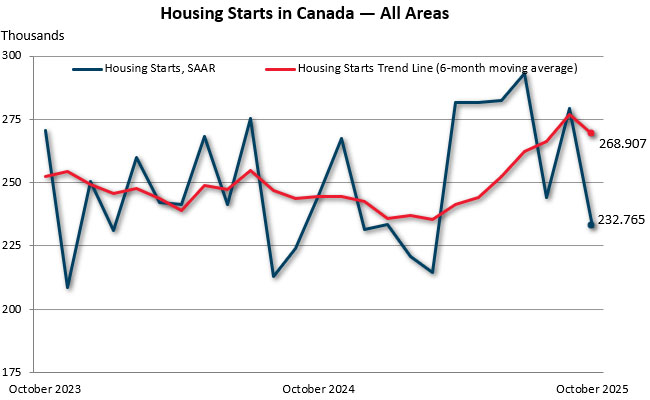
The six-month trend in housing starts decreased (3%) in October (268,907 units), according to Canada Mortgage and Housing Corporation (CMHC). The trend measure is a six-month moving average of the seasonally adjusted annual rate (SAAR) of total housing starts for all areas in Canada.
Actual housing starts were down 3% year-over-year in centres with a population of 10,000 or greater, with 19,174 units recorded in October, compared to 19,763 units in October 2024. The year-to-date total was 197,207, up 5% from the same period in 2024.
The total monthly SAAR of housing starts for all areas in Canada was down 17% in October (232,765 units) compared to September (279,174 units).
“Both the six-month trend in housing starts and the SAAR were pushed lower in October by significantly lower monthly starts in Ontario and British Columbia. However, higher starts in markets like Montréal, Calgary, and Edmonton continue to keep national year-to-date elevated compared to the same period last year. While these results are generally reflective of investment decisions made months or even years ago, they also highlight persistent and significant regional contrasts in housing construction trends across the country,” said Tania Bourassa-Ochoa, CMHC’s Deputy Chief Economist.
Key facts:
- New: As part of the Modernizing Housing Data initiative, new housing completions data for centres with a population of 10,000+ and absorptions data for centres with a population of 50,000+ is now available on the Housing Market Information Portal.
- The rural starts monthly SAAR estimate was 22,062 units.
- Among Canada’s big three cities, Montreal posted a 104% year-over-year increase in actual housing starts this month driven by significantly higher multi-unit starts. Vancouver recorded a 36% decrease in starts due to fewer multi-unit starts. Toronto declined 42% with both multi-unit and single-detached starts considerably lower.
- CMHC’s Starts and Completions Survey provides Canadians with objective, accurate and timely information on actual new residential construction in Canada. Read more about why housing starts matter on CMHC’s Housing Observer.
- Monthly Housing Starts and Other Construction Data are accessible in English and French on our website and the CMHC Housing Market Information Portal.
- Housing starts data is available on the eleventh business day each month. We will release the November housing starts data on December 15 at 8:15 AM ET.
- CMHC uses the trend measure as a complement to the monthly SAAR of housing starts to account for considerable swings in monthly estimates and to obtain a clearer picture of upcoming new housing supply. In some situations, analyzing only SAAR data can be misleading, as the multi-unit segment largely drives the market and can vary significantly from one month to the next.
- Read about our definitions and methodology to better understand the foundations of the Starts and Completions and Market Absorption surveys.
Housing starts facilitate the analysis of monthly, quarterly, and year-over-year activity in the new home market. The data CMHC collects as part of the Starts and Completions and Market Absorption surveys helps us obtain a clearer picture of upcoming new housing supply and is used as part of our various housing reports.
CMHC plays a critical role as a national convenor to promote stability and sustainability in Canada’s housing finance system. CMHC’s mortgage insurance products support access to home ownership and the creation and maintenance of rental supply. CMHC research and data help inform housing policy. By facilitating co-operation between all levels of government, private and non-profit sectors, CMHC contributes to advancing housing affordability, equity, and climate compatibility. CMHC actively supports the Government of Canada in delivering on its commitment to make housing more affordable.
Follow us on X, YouTube, LinkedIn, Facebook and Instagram.
Related links:
- Housing starts for September 2025
- 2025 Housing Supply Report
- Housing shortages in Canada
- Unlocking housing supply: Why scale really matters
- How common is “Missing Middle” housing development in Canada?
Information on this release:
To request an interview with a CMHC economist, contact:
Media Relations, CMHC
media@cmhc-schl.gc.ca
| Single-Detached | All Others | Total | |||||||
|---|---|---|---|---|---|---|---|---|---|
| Sept. 2025 | Oct. 2025 | % | Sept. 2025 | Oct. 2025 | % | Sept. 2025 | Oct. 2025 | % | |
| N.L. | 687 | 681 | -1 | 444 | 374 | -16 | 1,131 | 1,055 | -7 |
| P.E.I. | 367 | 372 | 1 | 1,114 | 880 | -21 | 1,481 | 1,252 | -15 |
| N.S. | 1,734 | 1,715 | -1 | 8,048 | 7,321 | -9 | 9,782 | 9,036 | -8 |
| N.B. | 931 | 937 | 1 | 5,124 | 5,427 | 6 | 6,055 | 6,365 | 5 |
| Qc | 4,766 | 4,837 | 1 | 45,989 | 46,744 | 2 | 50,754 | 51,581 | 2 |
| Ont. | 10,126 | 10,016 | -1 | 57,542 | 53,322 | -7 | 67,669 | 63,338 | -6 |
| Man. | 2,302 | 2,266 | -2 | 5,210 | 5,232 | 0 | 7,512 | 7,498 | 0 |
| Sask. | 1,722 | 1,785 | 4 | 4,106 | 4,046 | -1 | 5,828 | 5,831 | 0 |
| Alta. | 15,536 | 14,842 | -4 | 40,864 | 40,707 | 0 | 56,401 | 55,548 | -2 |
| B.C. | 3,969 | 4,114 | 4 | 43,544 | 40,135 | -8 | 47,512 | 44,249 | -7 |
| Canada (10,000+) | 42,140 | 41,563 | -1 | 211,985 | 204,189 | -4 | 254,125 | 245,752 | -3 |
| Canada (All Areas) | 55,774 | 55,380 | -1 | 221,306 | 213,526 | -4 | 277,081 | 268,907 | -3 |
Data based on 2021 Census Definitions.
Source: Market Analysis Centre, CMHC
| Single-Detached | All Others | Total | |||||||
|---|---|---|---|---|---|---|---|---|---|
| Sept. 2025 | Oct. 2025 | % | Sept. 2025 | Oct. 2025 | % | Sept. 2025 | Oct. 2025 | % | |
| Abbotsford – Mission | 149 | 167 | 12 | 2,060 | 2,080 | 1 | 2,209 | 2,247 | 2 |
| Barrie | 184 | 176 | -4 | 870 | 922 | 6 | 1,054 | 1,098 | 4 |
| Belleville – Quinte West | 165 | 178 | 8 | 370 | 430 | 16 | 535 | 608 | 14 |
| Brantford | 321 | 305 | -5 | 1,974 | 1,498 | -24 | 2,295 | 1,803 | -21 |
| Calgary | 6,894 | 6,337 | -8 | 21,796 | 22,260 | 2 | 28,690 | 28,597 | 0 |
| Chilliwack | 119 | 136 | 14 | 492 | 290 | -41 | 611 | 426 | -30 |
| Drummondville | 207 | 198 | -4 | 1,156 | 1,200 | 4 | 1,363 | 1,398 | 3 |
| Edmonton | 6,689 | 6,488 | -3 | 17,196 | 16,640 | -3 | 23,885 | 23,128 | -3 |
| Fredericton | 263 | 267 | 2 | 1,154 | 1,508 | 31 | 1,417 | 1,775 | 25 |
| Greater / Grand Sudbury | 104 | 120 | 15 | 244 | 256 | 5 | 348 | 376 | 8 |
| Guelph | 28 | 25 | -11 | 234 | 238 | 2 | 262 | 263 | 0 |
| Halifax | 795 | 867 | 9 | 7,050 | 6,272 | -11 | 7,845 | 7,139 | -9 |
| Hamilton | 369 | 360 | -2 | 2,774 | 2,532 | -9 | 3,143 | 2,892 | -8 |
| Kamloops | 48 | 47 | -2 | 400 | 396 | -1 | 448 | 443 | -1 |
| Kelowna | 267 | 269 | 1 | 2,886 | 2,856 | -1 | 3,153 | 3,125 | -1 |
| Kingston | 178 | 206 | 16 | 1,108 | 1,154 | 4 | 1,286 | 1,360 | 6 |
| Kitchener – Cambridge – Waterloo | 415 | 500 | 20 | 4,926 | 4,550 | -8 | 5,340 | 5,050 | -5 |
| Lethbridge | 384 | 396 | 3 | 158 | 118 | -25 | 542 | 514 | -5 |
| London | 480 | 418 | -13 | 3,680 | 3,946 | 7 | 4,160 | 4,364 | 5 |
| Moncton | 275 | 277 | 1 | 2,906 | 2,842 | -2 | 3,181 | 3,119 | -2 |
| Montréal | 1,270 | 1,301 | 2 | 26,419 | 28,176 | 7 | 27,689 | 29,476 | 6 |
| Nanaimo | 80 | 85 | 6 | 404 | 408 | 1 | 484 | 492 | 2 |
| Oshawa | 421 | 405 | -4 | 830 | 832 | 0 | 1,251 | 1,237 | -1 |
| Ottawa – Gatineau | 1,601 | 1,487 | -7 | 10,912 | 9,502 | -13 | 12,513 | 10,989 | -12 |
| Gatineau | 475 | 417 | -12 | 1,946 | 1,904 | -2 | 2,421 | 2,321 | -4 |
| Ottawa | 1,126 | 1,070 | -5 | 8,966 | 7,598 | -15 | 10,092 | 8,668 | -14 |
| Peterborough | 79 | 90 | 14 | 28 | 28 | - | 107 | 118 | 10 |
| Québec | 688 | 688 | - | 9,480 | 10,206 | 8 | 10,168 | 10,894 | 7 |
| Red Deer | 140 | 149 | 6 | 448 | 450 | 0 | 588 | 599 | 2 |
| Regina | 345 | 378 | 10 | 1,380 | 1,084 | -21 | 1,725 | 1,462 | -15 |
| Saguenay | 245 | 238 | -3 | 378 | 438 | 16 | 623 | 676 | 9 |
| St. Catharines – Niagara | 423 | 471 | 11 | 1,702 | 1,788 | 5 | 2,125 | 2,259 | 6 |
| Saint John | 239 | 253 | 6 | 436 | 466 | 7 | 675 | 719 | 7 |
| St. John's | 655 | 646 | -1 | 442 | 384 | -13 | 1,097 | 1,030 | -6 |
| Saskatoon | 1,295 | 1,349 | 4 | 2,658 | 2,890 | 9 | 3,953 | 4,239 | 7 |
| Sherbrooke | 263 | 256 | -3 | 1,540 | 1,426 | -7 | 1,803 | 1,682 | -7 |
| Thunder Bay | 110 | 98 | -11 | 182 | 206 | 13 | 292 | 304 | 4 |
| Toronto | 3,661 | 3,578 | -2 | 26,396 | 24,550 | -7 | 30,057 | 28,128 | -6 |
| Trois-Rivières | 145 | 132 | -9 | 1,468 | 1,768 | 20 | 1,613 | 1,900 | 18 |
| Vancouver | 2,059 | 2,210 | 7 | 28,760 | 25,700 | -11 | 30,819 | 27,909 | -9 |
| Victoria | 316 | 323 | 2 | 5,994 | 5,914 | -1 | 6,310 | 6,237 | -1 |
| Windsor | 336 | 314 | -7 | 1,096 | 1,090 | -1 | 1,432 | 1,404 | -2 |
| Winnipeg | 2,030 | 1,962 | -3 | 4,486 | 4,494 | 0 | 6,516 | 6,456 | -1 |
Data based on 2021 Census Definitions.
Source: Market Analysis Centre, CMHC
| Single-Detached | All Others | Total | |||||||
|---|---|---|---|---|---|---|---|---|---|
| 2024 | 2025 | % | 2024 | 2025 | % | 2024 | 2025 | % | |
| N.-L. | 512 | 571 | 12 | 287 | 307 | 7 | 799 | 878 | 10 |
| P.E.I. | 228 | 290 | 27 | 982 | 861 | -12 | 1,210 | 1,151 | -5 |
| N.S. | 1,329 | 1,374 | 3 | 4,403 | 5,859 | 33 | 5,732 | 7,233 | 26 |
| N.B. | 799 | 785 | -2 | 3,279 | 3,497 | 7 | 4,078 | 4,282 | 5 |
| Atlantic | 2,868 | 3,020 | 5 | 8,951 | 10,524 | 18 | 11,819 | 13,544 | 15 |
| Que. | 3,667 | 4,019 | 10 | 29,335 | 39,415 | 34 | 33,002 | 43,434 | 32 |
| Ont. | 10,864 | 8,165 | -25 | 50,765 | 41,513 | -18 | 61,629 | 49,678 | -19 |
| Man. | 1,456 | 1,935 | 33 | 3,666 | 3,789 | 3 | 5,122 | 5,724 | 12 |
| Sask. | 1,084 | 1,499 | 38 | 2,231 | 3,500 | 57 | 3,315 | 4,999 | 51 |
| Alta. | 12,748 | 13,154 | 3 | 25,327 | 32,392 | 28 | 38,075 | 45,546 | 20 |
| Prairies | 15,288 | 16,588 | 9 | 31,224 | 39,681 | 27 | 46,512 | 56,269 | 21 |
| B.C. | 3,732 | 3,409 | -9 | 31,966 | 30,873 | -3 | 35,698 | 34,282 | -4 |
| Canada | 36,419 | 35,201 | -3 | 152,241 | 162,006 | 6 | 188,660 | 197,207 | 5 |
1 Data for 2022 based on 2016 Census Definitions and data for 2023, 2024 and 2025 based on 2021 Census Definitions.
Source: CMHC Starts and Completion Survey, Market Absorption Survey
| Single-Detached | All Others | Total | |||||||
|---|---|---|---|---|---|---|---|---|---|
| 2024 | 2025 | % | 2024 | 2025 | % | 2024 | 2025 | % | |
| Abbotsford – Mission | 158 | 142 | -10 | 808 | 1,897 | 135 | 966 | 2,039 | 111 |
| Barrie | 360 | 129 | -64 | 472 | 559 | 18 | 832 | 688 | -17 |
| Belleville – Quinte West | 177 | 139 | -21 | 135 | 380 | 181 | 312 | 519 | 66 |
| Brantford | 172 | 240 | 40 | 92 | 1,329 | ## | 264 | 1,569 | 494 |
| Calgary | 5,869 | 5,776 | -2 | 14,235 | 18,175 | 28 | 20,104 | 23,951 | 19 |
| Chilliwack | 127 | 112 | -12 | 282 | 382 | 35 | 409 | 494 | 21 |
| Drummondville | 141 | 182 | 29 | 697 | 854 | 23 | 838 | 1,036 | 24 |
| Edmonton | 5,619 | 5,805 | 3 | 9,177 | 12,184 | 33 | 14,796 | 17,989 | 22 |
| Fredericton | 258 | 223 | -14 | 320 | 879 | 175 | 578 | 1,102 | 91 |
| Greater/Grand Sudbury | 89 | 82 | -8 | 67 | 133 | 99 | 156 | 215 | 38 |
| Guelph | 49 | 27 | -45 | 346 | 126 | -64 | 395 | 153 | -61 |
| Halifax | 662 | 690 | 4 | 3,789 | 5,203 | 37 | 4,451 | 5,893 | 32 |
| Hamilton | 328 | 261 | -20 | 1,741 | 1,891 | 9 | 2,069 | 2,152 | 4 |
| Kamloops | 78 | 68 | -13 | 256 | 304 | 19 | 334 | 372 | 11 |
| Kelowna | 313 | 218 | -30 | 3,406 | 2,096 | -38 | 3,719 | 2,314 | -38 |
| Kingston | 193 | 166 | -14 | 316 | 793 | 151 | 509 | 959 | 88 |
| Kitchener – Cambridge – Waterloo | 314 | 363 | 16 | 2,350 | 3,293 | 40 | 2,664 | 3,656 | 37 |
| Lethbridge | 213 | 304 | 43 | 411 | 201 | -51 | 624 | 505 | -19 |
| London | 459 | 394 | -14 | 3,059 | 2,198 | -28 | 3,518 | 2,592 | -26 |
| Moncton | 225 | 244 | 8 | 2,227 | 1,968 | -12 | 2,452 | 2,212 | -10 |
| Montréal | 936 | 1,113 | 19 | 12,945 | 21,060 | 63 | 13,881 | 22,173 | 60 |
| Nanaimo | 137 | 79 | -42 | 677 | 309 | -54 | 814 | 388 | -52 |
| Oshawa | 377 | 329 | -13 | 1,142 | 518 | -55 | 1,519 | 847 | -44 |
| Ottawa – Gatineau | 1,504 | 1,440 | -4 | 8,105 | 8,422 | 4 | 9,609 | 9,862 | 3 |
| Gatineau | 335 | 339 | 1 | 2,754 | 1,578 | -43 | 3,089 | 1,917 | -38 |
| Ottawa | 1,169 | 1,101 | -6 | 5,351 | 6,844 | 28 | 6,520 | 7,945 | 22 |
| Peterborough | 110 | 65 | -41 | 128 | 17 | -87 | 238 | 82 | -66 |
| Québec | 511 | 591 | 16 | 5,160 | 7,075 | 37 | 5,671 | 7,666 | 35 |
| Red Deer | 76 | 117 | 54 | 251 | 242 | -4 | 327 | 359 | 10 |
| Regina | 245 | 328 | 34 | 836 | 1,235 | 48 | 1,081 | 1,563 | 45 |
| Saguenay | 161 | 196 | 22 | 504 | 370 | -27 | 665 | 566 | -15 |
| St. Catharines – Niagara | 548 | 357 | -35 | 841 | 1,284 | 53 | 1,389 | 1,641 | 18 |
| Saint John | 186 | 201 | 8 | 444 | 260 | -41 | 630 | 461 | -27 |
| St. John's | 435 | 530 | 22 | 251 | 297 | 18 | 686 | 827 | 21 |
| Saskatoon | 774 | 1,111 | 44 | 1,356 | 2,164 | 60 | 2,130 | 3,275 | 54 |
| Sherbrooke | 239 | 219 | -8 | 1,287 | 1,093 | -15 | 1,526 | 1,312 | -14 |
| Thunder Bay | 70 | 81 | 16 | 202 | 123 | -39 | 272 | 204 | -25 |
| Toronto | 3,922 | 2,732 | -30 | 30,515 | 18,842 | -38 | 34,437 | 21,574 | -37 |
| Trois-Rivières | 174 | 143 | -18 | 1,292 | 1,110 | -14 | 1,466 | 1,253 | -15 |
| Vancouver | 1,820 | 1,806 | -1 | 21,224 | 20,195 | -5 | 23,044 | 22,001 | -5 |
| Victoria | 247 | 238 | -4 | 3,112 | 3,891 | 25 | 3,359 | 4,129 | 23 |
| Windsor | 392 | 274 | -30 | 1,488 | 653 | -56 | 1,880 | 927 | -51 |
| Winnipeg | 1,209 | 1,685 | 39 | 3,129 | 3,229 | 3 | 4,338 | 4,914 | 13 |
| Total | 29,877 | 29,200 | -2 | 139,075 | 147,234 | 6 | 168,952 | 176,434 | 4 |
1 Data for 2022 based on 2016 Census Definitions and data for 2023, 2024 and 2025 based on 2021 Census Definitions.
Source: CMHC Starts and Completion Survey, Market Absorption Survey
| Single-Detached | All Others | Total | |||||||
|---|---|---|---|---|---|---|---|---|---|
| Oct. 2024 | Oct. 2025 | % | Oct. 2024 | Oct. 2025 | % | Oct. 2024 | Oct. 2025 | % | |
| N.-L. | 54 | 61 | 13 | 55 | 27 | -51 | 109 | 88 | -19 |
| P.E.I. | 39 | 48 | 23 | 86 | 21 | -76 | 125 | 69 | -45 |
| N.S. | 156 | 154 | -1 | 204 | 533 | 161 | 360 | 687 | 91 |
| N.B. | 89 | 84 | -6 | 300 | 301 | 0 | 389 | 385 | -1 |
| Atlantic | 338 | 347 | 3 | 645 | 882 | 37 | 983 | 1,229 | 25 |
| Qc | 541 | 542 | 0 | 3,672 | 5,110 | 39 | 4,213 | 5,652 | 34 |
| Ont. | 1,288 | 970 | -25 | 4,213 | 2,597 | -38 | 5,501 | 3,567 | -35 |
| Man. | 157 | 224 | 43 | 560 | 283 | -49 | 717 | 507 | -29 |
| Sask. | 173 | 233 | 35 | 231 | 458 | 98 | 404 | 691 | 71 |
| Alta. | 1,453 | 1,243 | -14 | 3,045 | 3,589 | 18 | 4,498 | 4,832 | 7 |
| Prairies | 1,783 | 1,700 | -5 | 3,836 | 4,330 | 13 | 5,619 | 6,030 | 7 |
| B.C. | 383 | 410 | 7 | 3,064 | 2,286 | -25 | 3,447 | 2,696 | -22 |
| Canada (10,000+) | 4,333 | 3,969 | -8 | 15,430 | 15,205 | -1 | 19,763 | 19,174 | -3 |
Data for 2022 based on 2016 Census Definitions and data for 2023, 2024 and 2025 based on 2021 Census Definitions.
Source: CMHC Starts and Completion Survey, Market Absorption Survey
## not calculable / extreme value
| Single-Detached | All Others | Total | |||||||
|---|---|---|---|---|---|---|---|---|---|
| Oct. 2024 | Oct. 2025 | % | Oct. 2024 | Oct. 2025 | % | Oct. 2024 | Oct. 2025 | % | |
| Abbotsford – Mission | 12 | 15 | 25 | 52 | 212 | 308 | 64 | 227 | 255 |
| Barrie | 48 | 0 | ### | 26 | 60 | 131 | 74 | 60 | -19 |
| Belleville – Quinte West | 14 | 21 | 50 | 12 | 30 | 150 | 26 | 51 | 96 |
| Brantford | 4 | 18 | 350 | 53 | 31 | -42 | 57 | 49 | -14 |
| Calgary | 644 | 545 | -15 | 2,046 | 2,513 | 23 | 2,690 | 3,058 | 14 |
| Chilliwack | 6 | 13 | 117 | 4 | 20 | 400 | 10 | 33 | 230 |
| Drummondville | 16 | 16 | - | 76 | 79 | 4 | 92 | 95 | 3 |
| Edmonton | 627 | 526 | -16 | 810 | 979 | 21 | 1,437 | 1,505 | 5 |
| Fredericton | 32 | 24 | -25 | 40 | 177 | 343 | 72 | 201 | 179 |
| Greater / Grand Sudbury | 28 | 11 | -61 | 9 | 6 | -33 | 37 | 17 | -54 |
| Guelph | 6 | 4 | -33 | 4 | 8 | 100 | 10 | 12 | 20 |
| Halifax | 58 | 81 | 40 | 107 | 471 | 340 | 165 | 552 | 235 |
| Hamilton | 78 | 29 | -63 | 50 | 58 | 16 | 128 | 87 | -32 |
| Kamloops | 10 | 6 | -40 | 60 | 2 | -97 | 70 | 8 | -89 |
| Kelowna | 33 | 20 | -39 | 19 | 162 | ## | 52 | 182 | 250 |
| Kingston | 22 | 42 | 91 | 167 | 56 | -66 | 189 | 98 | -48 |
| Kitchener – Cambridge – Waterloo | 24 | 90 | 275 | 288 | 41 | -86 | 312 | 131 | -58 |
| Lethbridge | 19 | 30 | 58 | 6 | 0 | -100 | 25 | 30 | 20 |
| London | 44 | 26 | -41 | 472 | 163 | -65 | 516 | 189 | -63 |
| Moncton | 26 | 22 | -15 | 244 | 94 | -61 | 270 | 116 | -57 |
| Montréal | 122 | 161 | 32 | 1,270 | 2,681 | 111 | 1,392 | 2,842 | 104 |
| Nanaimo | 23 | 14 | -39 | 7 | 20 | 186 | 30 | 34 | 13 |
| Oshawa | 39 | 26 | -33 | 8 | 36 | 350 | 47 | 62 | 32 |
| Ottawa – Gatineau | 179 | 201 | 12 | 1,186 | 709 | -40 | 1,365 | 910 | -33 |
| Gatineau | 59 | 31 | -47 | 670 | 102 | -85 | 729 | 133 | -82 |
| Ottawa | 120 | 170 | 42 | 516 | 607 | 18 | 636 | 777 | 22 |
| Peterborough | 8 | 7 | -13 | 15 | 0 | -100 | 23 | 7 | -70 |
| Québec | 59 | 62 | 5 | 366 | 984 | 169 | 425 | 1,046 | 146 |
| Red Deer | 9 | 21 | 133 | 4 | 1 | -75 | 13 | 22 | 69 |
| Regina | 41 | 44 | 7 | 102 | 114 | 12 | 143 | 158 | 10 |
| Saguenay | 9 | 14 | 56 | 289 | 43 | -85 | 298 | 57 | -81 |
| St. Catharines – Niagara | 31 | 41 | 32 | 60 | 99 | 65 | 91 | 140 | 54 |
| Saint John | 20 | 26 | 30 | 6 | 16 | 167 | 26 | 42 | 62 |
| St. John's | 47 | 56 | 19 | 55 | 25 | -55 | 102 | 81 | -21 |
| Saskatoon | 127 | 183 | 44 | 128 | 331 | 159 | 255 | 514 | 102 |
| Sherbrooke | 19 | 22 | 16 | 334 | 105 | -69 | 353 | 127 | -64 |
| Thunder Bay | 14 | 3 | -79 | 72 | 12 | -83 | 86 | 15 | -83 |
| Toronto | 533 | 327 | -39 | 1,956 | 1,118 | -43 | 2,489 | 1,445 | -42 |
| Trois-Rivières | 14 | 8 | -43 | 23 | 217 | ## | 37 | 225 | ## |
| Vancouver | 175 | 244 | 39 | 2,366 | 1,384 | -42 | 2,541 | 1,628 | -36 |
| Victoria | 31 | 27 | -13 | 262 | 331 | 26 | 293 | 358 | 22 |
| Windsor | 57 | 24 | -58 | 94 | 32 | -66 | 151 | 56 | -63 |
| Winnipeg | 138 | 188 | 36 | 515 | 203 | -61 | 653 | 391 | -40 |
| Total | 3,446 | 3,238 | -6 | 13,663 | 13,623 | 0 | 17,109 | 16,861 | -1 |
Data for 2022 based on 2016 Census Definitions and data for 2023, 2024 and 2025 based on 2021 Census Definitions.
Source: CMHC Starts and Completion Survey, Market Absorption Survey
## not calculable / extreme value
