


 Share via Email
Nationally, the housing starts total for all areas in Canada in 2025 was 259,028, the fifth highest annual total on record and up 5.6% compared to 2024 (245,367). Actual 2025 housing starts in centres of 10,000 population and over were up 6%, with 241,171 units recorded, compared to 227,697 in 2024, according to Canada Mortgage and Housing Corporation (CMHC). These increases were driven by a second consecutive year of record rental housing starts which made up just over half of all housing starts in Canada’s urban centres.
Canada’s six largest Census Metropolitan Areas (CMAs) saw a combined 3.9% year-over-year increase from 2024, driven by record annual starts in Calgary and Edmonton, a 58% year-over-year increase in annual starts in Montréal, and a 12% increase in Ottawa-Gatineau. These results made up for year-over-year decreases in Toronto (-31%) and Vancouver (-3%).
Monthly Housing Starts:
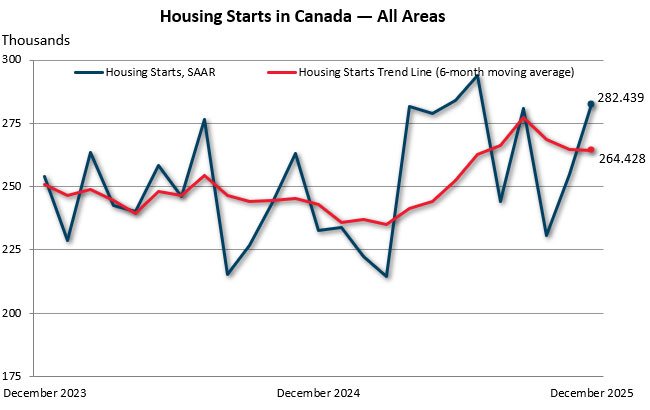
The six-month trend in housing starts was flat (-0.1%) in December (264,428 units), according to Canada Mortgage and Housing Corporation (CMHC). The trend measure is a six-month moving average of the seasonally adjusted annual rate (SAAR) of total housing starts for all areas in Canada.
The total monthly SAAR of housing starts for all areas in Canada was up 11% in December (282,439 units) compared to November (254,625 units).
Actual housing starts increased 25% year-over-year in centres with a population of 10,000 or greater, with 20,716 units recorded in December, compared to 16,531 units in December 2024. This marks the most actual housing starts for December on record, primarily driven by increases in Ontario, which had its highest monthly starts total of 2025.
Quote:
"While housing starts in 2025 finished ahead of 2024 and inched up in December, most of the momentum in housing construction occurred in the Spring and Summer. Since September, the trend in housing starts has consistently decreased. In 2025, economic uncertainty and the diminished viability of large residential towers encouraged a shift towards smaller-scale projects,” said Mathieu Laberge, Chief Economist and SVP, Housing Insights at CMHC. "As such, housing starts are beginning this year from a weaker position and market intelligence suggests slowing momentum for residential construction. These trends, along with geopolitical and trade uncertainty, remain top of mind as we expect to release an updated Housing Market Outlook in February."
Key facts:
- As part of the Modernizing Housing Data initiative, new housing completions data for centres with a population of 10,000+ and absorptions data for centres with a population of 50,000+ is now available on the Housing Market Information Portal.
- The rural starts monthly SAAR estimate was 12,271 units.
- Among Canada’s big three cities, all saw year-over-year increases in December. Toronto led the way with a 151% increase, driven by higher multi-unit starts. Montreal posted a 123% year-over-year increase, driven by higher starts across all dwelling types. Vancouver recorded a +17% increase in December, also driven by multi-unit starts.
- CMHC’s Starts and Completions Survey provides Canadians with objective, accurate and timely information on actual new residential construction in Canada. Read more about why housing starts matter on CMHC’s Housing Observer.
- Monthly Housing Starts and Other Construction Data are accessible in English and French on our website and the CMHC Housing Market Information Portal.
- Housing starts data is available on the eleventh business day each month. We will release the January housing starts data on February 16 at 8:15 AM ET.
- CMHC uses the trend measure as a complement to the monthly SAAR of housing starts to account for considerable swings in monthly estimates and to obtain a clearer picture of upcoming new housing supply. In some situations, analyzing only SAAR data can be misleading, as the multi-unit segment largely drives the market and can vary significantly from one month to the next.
- Read about our definitions and methodology to better understand the foundations of the Starts and Completions and Market Absorption surveys.
Housing starts facilitate the analysis of monthly, quarterly, and year-over-year activity in the new home market. The data CMHC collects as part of the Starts and Completions and Market Absorption surveys helps us obtain a clearer picture of upcoming new housing supply and is used as part of our various housing reports.
CMHC plays a critical role as a national convenor to promote stability and sustainability in Canada’s housing finance system. CMHC’s mortgage insurance products support access to home ownership and the creation and maintenance of rental supply. CMHC research and data help inform housing policy. By facilitating co-operation between all levels of government, private and non-profit sectors, CMHC contributes to advancing housing affordability, equity, and climate compatibility. CMHC actively supports the Government of Canada in delivering on its commitment to make housing more affordable.
Follow us on X, YouTube, LinkedIn, Facebook and Instagram.
Related links:
- Housing starts for November 2025
- Housing shortages in Canada
- We built this city on… Development charges
- Framework for change: Productivity in housing construction
- Unlocking housing supply: Why scale really matters
Information on this release:
To request an interview with a CMHC economist, contact:
Media Relations, CMHC
media@cmhc-schl.gc.ca
| Single-Detached | All Others | Total | |||||||
|---|---|---|---|---|---|---|---|---|---|
| Nov. 2025 | Dec. 2025 | % | Nov. 2025 | Dec. 2025 | % | Nov. 2025 | Dec. 2025 | % | |
| N.L. | 714 | 736 | 3 | 457 | 450 | -2 | 1,171 | 1,187 | 1 |
| P.E.I. | 350 | 351 | 0 | 906 | 998 | 10 | 1,256 | 1,349 | 7 |
| N.S. | 1,676 | 1,603 | -4 | 7,161 | 7,653 | 7 | 8,837 | 9,256 | 5 |
| N.B. | 1,021 | 1,082 | 6 | 6,409 | 5,866 | -8 | 7,430 | 6,947 | -7 |
| Qc | 4,862 | 4,802 | -1 | 48,078 | 49,983 | 4 | 52,940 | 54,785 | 3 |
| Ont. | 10,378 | 9,942 | -4 | 51,105 | 57,362 | 12 | 61,482 | 67,304 | 9 |
| Man. | 2,223 | 2,227 | 0 | 6,138 | 5,908 | -4 | 8,361 | 8,135 | -3 |
| Sask. | 1,761 | 1,874 | 6 | 3,658 | 3,698 | 1 | 5,419 | 5,572 | 3 |
| Alta. | 14,178 | 13,821 | -3 | 38,849 | 35,802 | -8 | 53,026 | 49,623 | -6 |
| B.C. | 4,202 | 4,291 | 2 | 40,826 | 37,730 | -8 | 45,028 | 42,021 | -7 |
| Canada (10,000+) | 41,363 | 40,727 | -2 | 203,586 | 205,450 | 1 | 244,949 | 246,177 | 1 |
| Canada (All Areas) | 52,742 | 50,938 | -3 | 211,974 | 213,490 | 1 | 264,716 | 264,428 | 0 |
Data based on 2021 Census Definitions.
Source: Market Analysis Centre, CMHC
| Single-Detached | All Others | Total | |||||||
|---|---|---|---|---|---|---|---|---|---|
| Nov. 2025 | Dec. 2025 | % | Nov. 2025 | Dec. 2025 | % | Nov. 2025 | Dec. 2025 | % | |
| Abbotsford – Mission | 184 | 181 | -2 | 2,044 | 1,502 | -27 | 2,228 | 1,683 | -24 |
| Barrie | 215 | 195 | -9 | 976 | 914 | -6 | 1,191 | 1,109 | -7 |
| Belleville – Quinte West | 180 | 174 | -3 | 472 | 568 | 20 | 652 | 742 | 14 |
| Brantford | 363 | 278 | -23 | 834 | 592 | -29 | 1,197 | 870 | -27 |
| Calgary | 6,148 | 5,934 | -3 | 21,336 | 19,664 | -8 | 27,484 | 25,598 | -7 |
| Chilliwack | 137 | 130 | -5 | 384 | 432 | 13 | 521 | 562 | 8 |
| Drummondville | 223 | 201 | -10 | 1,380 | 1,366 | -1 | 1,603 | 1,567 | -2 |
| Edmonton | 6,078 | 5,939 | -2 | 16,062 | 14,610 | -9 | 22,140 | 20,549 | -7 |
| Fredericton | 319 | 323 | 1 | 1,738 | 1,440 | -17 | 2,057 | 1,763 | -14 |
| Greater / Grand Sudbury | 125 | 113 | -10 | 326 | 344 | 6 | 451 | 456 | 1 |
| Guelph | 28 | 30 | 7 | 226 | 506 | 124 | 254 | 536 | 111 |
| Halifax | 861 | 841 | -2 | 5,956 | 6,454 | 8 | 6,817 | 7,296 | 7 |
| Hamilton | 404 | 360 | -11 | 2,468 | 4,074 | 65 | 2,872 | 4,434 | 54 |
| Kamloops | 65 | 86 | 32 | 440 | 450 | 2 | 505 | 536 | 6 |
| Kelowna | 251 | 241 | -4 | 2,476 | 1,318 | -47 | 2,727 | 1,559 | -43 |
| Kingston | 256 | 226 | -12 | 1,158 | 332 | -71 | 1,414 | 558 | -61 |
| Kitchener – Cambridge – Waterloo | 514 | 538 | 5 | 4,584 | 5,588 | 22 | 5,098 | 6,126 | 20 |
| Lethbridge | 359 | 372 | 4 | 46 | 118 | 157 | 405 | 490 | 21 |
| London | 418 | 382 | -9 | 4,492 | 4,224 | -6 | 4,910 | 4,606 | -6 |
| Moncton | 310 | 326 | 5 | 3,146 | 2,790 | -11 | 3,456 | 3,117 | -10 |
| Montréal | 1,331 | 1,477 | 11 | 29,380 | 28,750 | -2 | 30,711 | 30,227 | -2 |
| Nanaimo | 107 | 109 | 2 | 434 | 362 | -17 | 541 | 471 | -13 |
| Oshawa | 362 | 418 | 15 | 938 | 932 | -1 | 1,300 | 1,350 | 4 |
| Ottawa – Gatineau | 1,652 | 1,708 | 3 | 9,558 | 11,132 | 16 | 11,210 | 12,840 | 15 |
| Gatineau | 429 | 350 | -18 | 1,258 | 1,254 | 0 | 1,687 | 1,604 | -5 |
| Ottawa | 1,223 | 1,358 | 11 | 8,300 | 9,878 | 19 | 9,523 | 11,236 | 18 |
| Peterborough | 87 | 88 | 1 | 28 | 28 | - | 115 | 116 | 1 |
| Québec | 688 | 663 | -4 | 7,652 | 6,842 | -11 | 8,340 | 7,505 | -10 |
| Red Deer | 138 | 115 | -17 | 116 | 118 | 2 | 254 | 233 | -8 |
| Regina | 391 | 408 | 4 | 1,108 | 1,040 | -6 | 1,499 | 1,447 | -3 |
| Saguenay | 236 | 257 | 9 | 460 | 706 | 53 | 696 | 963 | 38 |
| St. Catharines – Niagara | 452 | 503 | 11 | 2,038 | 2,644 | 30 | 2,490 | 3,147 | 26 |
| Saint John | 251 | 276 | 10 | 594 | 598 | 1 | 845 | 874 | 3 |
| St. John's | 670 | 688 | 3 | 450 | 426 | -5 | 1,120 | 1,114 | -1 |
| Saskatoon | 1,299 | 1,406 | 8 | 2,514 | 2,642 | 5 | 3,813 | 4,047 | 6 |
| Sherbrooke | 247 | 242 | -2 | 1,864 | 1,740 | -7 | 2,111 | 1,982 | -6 |
| Thunder Bay | 87 | 78 | -10 | 196 | 184 | -6 | 283 | 262 | -7 |
| Toronto | 3,399 | 3,000 | -12 | 21,540 | 23,440 | 9 | 24,939 | 26,440 | 6 |
| Trois-Rivières | 147 | 159 | 8 | 1,342 | 1,258 | -6 | 1,489 | 1,417 | -5 |
| Vancouver | 2,205 | 2,258 | 2 | 26,934 | 26,440 | -2 | 29,139 | 28,698 | -2 |
| Victoria | 362 | 333 | -8 | 5,672 | 4,674 | -18 | 6,034 | 5,007 | -17 |
| Windsor | 308 | 304 | -1 | 1,426 | 1,332 | -7 | 1,734 | 1,636 | -6 |
| Winnipeg | 1,903 | 1,877 | -1 | 5,140 | 4,910 | -4 | 7,043 | 6,787 | -4 |
Data based on 2021 Census Definitions.
Source: Market Analysis Centre, CMHC
| Single-Detached | All Others | Total | |||||||
|---|---|---|---|---|---|---|---|---|---|
| 2024 | 2025 | % | 2024 | 2025 | % | 2024 | 2025 | % | |
| N.-L. | 644 | 708 | 10 | 370 | 423 | 14 | 1,014 | 1,131 | 12 |
| P.E.I. | 267 | 333 | 25 | 1,067 | 943 | -12 | 1,334 | 1,276 | -4 |
| N.S. | 1,609 | 1,626 | 1 | 5,054 | 7,106 | 41 | 6,663 | 8,732 | 31 |
| N.B. | 974 | 1,016 | 4 | 4,013 | 4,701 | 17 | 4,987 | 5,717 | 15 |
| Atlantic | 3,494 | 3,683 | 5 | 10,504 | 13,173 | 25 | 13,998 | 16,856 | 20 |
| Que. | 4,537 | 4,759 | 5 | 36,684 | 49,461 | 35 | 41,221 | 54,220 | 32 |
| Ont. | 13,161 | 10,057 | -24 | 58,957 | 52,504 | -11 | 72,118 | 62,561 | -13 |
| Man. | 1,714 | 2,254 | 32 | 4,450 | 4,885 | 10 | 6,164 | 7,139 | 16 |
| Sask. | 1,337 | 1,828 | 37 | 2,654 | 3,851 | 45 | 3,991 | 5,679 | 42 |
| Alta. | 15,696 | 15,146 | -4 | 30,936 | 38,038 | 23 | 46,632 | 53,184 | 14 |
| Prairies | 18,747 | 19,228 | 3 | 38,040 | 46,774 | 23 | 56,787 | 66,002 | 16 |
| B.C. | 4,444 | 4,124 | -7 | 39,129 | 37,408 | -4 | 43,573 | 41,532 | -5 |
| Canada | 44,383 | 41,851 | -6 | 183,314 | 199,320 | 9 | 227,697 | 241,171 | 6 |
1 Data for 2022 based on 2016 Census Definitions and data for 2023, 2024 and 2025 based on 2021 Census Definitions.
Source: CMHC Starts and Completion Survey, Market Absorption Survey
| Single-Detached | All Others | Total | |||||||
|---|---|---|---|---|---|---|---|---|---|
| 2024 | 2025 | % | 2024 | 2025 | % | 2024 | 2025 | % | |
| Abbotsford – Mission | 182 | 180 | -1 | 1,001 | 1,945 | 94 | 1,183 | 2,125 | 80 |
| Barrie | 453 | 190 | -58 | 1,052 | 612 | -42 | 1,505 | 802 | -47 |
| Belleville – Quinte West | 229 | 168 | -27 | 158 | 468 | 196 | 387 | 636 | 64 |
| Brantford | 207 | 300 | 45 | 152 | 1,350 | ## | 359 | 1,650 | 360 |
| Calgary | 7,100 | 6,688 | -6 | 17,269 | 20,996 | 22 | 24,369 | 27,684 | 14 |
| Chilliwack | 149 | 132 | -11 | 501 | 466 | -7 | 650 | 598 | -8 |
| Drummondville | 171 | 225 | 32 | 889 | 1,164 | 31 | 1,060 | 1,389 | 31 |
| Edmonton | 6,976 | 6,612 | -5 | 11,408 | 14,725 | 29 | 18,384 | 21,337 | 16 |
| Fredericton | 317 | 305 | -4 | 432 | 1,122 | 160 | 749 | 1,427 | 91 |
| Greater/Grand Sudbury | 131 | 95 | -27 | 523 | 260 | -50 | 654 | 355 | -46 |
| Guelph | 63 | 33 | -48 | 389 | 288 | -26 | 452 | 321 | -29 |
| Halifax | 816 | 817 | 0 | 4,265 | 6,183 | 45 | 5,081 | 7,000 | 38 |
| Hamilton | 416 | 344 | -17 | 2,211 | 2,802 | 27 | 2,627 | 3,146 | 20 |
| Kamloops | 88 | 90 | 2 | 542 | 351 | -35 | 630 | 441 | -30 |
| Kelowna | 361 | 262 | -27 | 3,429 | 2,338 | -32 | 3,790 | 2,600 | -31 |
| Kingston | 239 | 213 | -11 | 776 | 881 | 14 | 1,015 | 1,094 | 8 |
| Kitchener – Cambridge – Waterloo | 376 | 433 | 15 | 3,035 | 3,873 | 28 | 3,411 | 4,306 | 26 |
| Lethbridge | 272 | 371 | 36 | 443 | 249 | -44 | 715 | 620 | -13 |
| London | 564 | 451 | -20 | 3,607 | 2,655 | -26 | 4,171 | 3,106 | -26 |
| Moncton | 279 | 311 | 11 | 2,718 | 2,489 | -8 | 2,997 | 2,800 | -7 |
| Montréal | 1,107 | 1,347 | 22 | 16,463 | 26,430 | 61 | 17,570 | 27,777 | 58 |
| Nanaimo | 169 | 104 | -38 | 860 | 344 | -60 | 1,029 | 448 | -56 |
| Oshawa | 425 | 376 | -12 | 1,166 | 638 | -45 | 1,591 | 1,014 | -36 |
| Ottawa – Gatineau | 1,916 | 1,775 | -7 | 9,633 | 11,209 | 16 | 11,549 | 12,984 | 12 |
| Gatineau | 401 | 378 | -6 | 3,254 | 1,742 | -46 | 3,655 | 2,120 | -42 |
| Ottawa | 1,515 | 1,397 | -8 | 6,379 | 9,467 | 48 | 7,894 | 10,864 | 38 |
| Peterborough | 134 | 83 | -38 | 179 | 17 | -91 | 313 | 100 | -68 |
| Québec | 589 | 704 | 20 | 6,316 | 7,879 | 25 | 6,905 | 8,583 | 24 |
| Red Deer | 96 | 130 | 35 | 258 | 275 | 7 | 354 | 405 | 14 |
| Regina | 288 | 398 | 38 | 935 | 1,289 | 38 | 1,223 | 1,687 | 38 |
| Saguenay | 226 | 235 | 4 | 682 | 562 | -18 | 908 | 797 | -12 |
| St. Catharines – Niagara | 648 | 452 | -30 | 1,095 | 2,062 | 88 | 1,743 | 2,514 | 44 |
| Saint John | 230 | 249 | 8 | 537 | 417 | -22 | 767 | 666 | -13 |
| St. John's | 548 | 652 | 19 | 323 | 385 | 19 | 871 | 1,037 | 19 |
| Saskatoon | 977 | 1,346 | 38 | 1,679 | 2,466 | 47 | 2,656 | 3,812 | 44 |
| Sherbrooke | 315 | 251 | -20 | 1,617 | 1,562 | -3 | 1,932 | 1,813 | -6 |
| Thunder Bay | 92 | 92 | - | 208 | 129 | -38 | 300 | 221 | -26 |
| Toronto | 4,723 | 3,257 | -31 | 32,995 | 22,830 | -31 | 37,718 | 26,087 | -31 |
| Trois-Rivières | 196 | 167 | -15 | 1,488 | 1,261 | -15 | 1,684 | 1,428 | -15 |
| Vancouver | 2,176 | 2,138 | -2 | 25,936 | 25,047 | -3 | 28,112 | 27,185 | -3 |
| Victoria | 298 | 309 | 4 | 3,887 | 4,550 | 17 | 4,185 | 4,859 | 16 |
| Windsor | 486 | 331 | -32 | 1,671 | 931 | -44 | 2,157 | 1,262 | -41 |
| Winnipeg | 1,434 | 1,943 | 35 | 3,717 | 4,118 | 11 | 5,151 | 6,061 | 18 |
| Total | 36,462 | 34,559 | -5 | 166,445 | 179,618 | 8 | 202,907 | 214,177 | 6 |
1 Data for 2022 based on 2016 Census Definitions and data for 2023, 2024 and 2025 based on 2021 Census Definitions.
Source: CMHC Starts and Completion Survey, Market Absorption Survey
| Single-Detached | All Others | Total | |||||||
|---|---|---|---|---|---|---|---|---|---|
| Dec. 2024 | Dec. 2025 | % | Dec. 2024 | Dec. 2025 | % | Dec. 2024 | Dec. 2025 | % | |
| N.-L. | 54 | 63 | 17 | 40 | 37 | -8 | 94 | 100 | 6 |
| P.E.I. | 26 | 33 | 27 | 82 | 61 | -26 | 108 | 94 | -13 |
| N.S. | 144 | 130 | -10 | 315 | 750 | 138 | 459 | 880 | 92 |
| N.B. | 63 | 96 | 52 | 336 | 251 | -25 | 399 | 347 | -13 |
| Atlantic | 287 | 322 | 12 | 773 | 1,099 | 42 | 1,060 | 1,421 | 34 |
| Qc | 309 | 260 | -16 | 2,332 | 3,715 | 59 | 2,641 | 3,975 | 51 |
| Ont. | 942 | 728 | -23 | 4,003 | 6,819 | 70 | 4,945 | 7,547 | 53 |
| Man. | 123 | 149 | 21 | 269 | 132 | -51 | 392 | 281 | -28 |
| Sask. | 111 | 174 | 57 | 154 | 257 | 67 | 265 | 431 | 63 |
| Alta. | 1,251 | 912 | -27 | 2,234 | 2,344 | 5 | 3,485 | 3,256 | -7 |
| Prairies | 1,485 | 1,235 | -17 | 2,657 | 2,733 | 3 | 4,142 | 3,968 | -4 |
| B.C. | 325 | 338 | 4 | 3,418 | 3,467 | 1 | 3,743 | 3,805 | 2 |
| Canada (10,000+) | 3,348 | 2,883 | -14 | 13,183 | 17,833 | 35 | 16,531 | 20,716 | 25 |
Data for 2022 based on 2016 Census Definitions and data for 2023, 2024 and 2025 based on 2021 Census Definitions.
Source: CMHC Starts and Completion Survey, Market Absorption Survey
## not calculable / extreme value
| Single-Detached | All Others | Total | |||||||
|---|---|---|---|---|---|---|---|---|---|
| Dec. 2024 | Dec. 2025 | % | Dec. 2024 | Dec. 2025 | % | Dec. 2024 | Dec. 2025 | % | |
| Abbotsford – Mission | 13 | 12 | -8 | 117 | 21 | -82 | 130 | 33 | -75 |
| Barrie | 31 | 7 | -77 | 548 | 3 | -99 | 579 | 10 | -98 |
| Belleville – Quinte West | 23 | 16 | -30 | 5 | 67 | ## | 28 | 83 | 196 |
| Brantford | 11 | 23 | 109 | 2 | 0 | -100 | 13 | 23 | 77 |
| Calgary | 514 | 360 | -30 | 1,203 | 885 | -26 | 1,717 | 1,245 | -27 |
| Chilliwack | 11 | 7 | -36 | 86 | 33 | -62 | 97 | 40 | -59 |
| Drummondville | 16 | 12 | -25 | 52 | 137 | 163 | 68 | 149 | 119 |
| Edmonton | 568 | 401 | -29 | 877 | 1,313 | 50 | 1,445 | 1,714 | 19 |
| Fredericton | 23 | 29 | 26 | 4 | 19 | 375 | 27 | 48 | 78 |
| Greater / Grand Sudbury | 9 | 4 | -56 | 35 | 23 | -34 | 44 | 27 | -39 |
| Guelph | 6 | 2 | -67 | 11 | 150 | ## | 17 | 152 | ## |
| Halifax | 78 | 59 | -24 | 250 | 650 | 160 | 328 | 709 | 116 |
| Hamilton | 31 | 22 | -29 | 453 | 877 | 94 | 484 | 899 | 86 |
| Kamloops | 3 | 13 | 333 | 2 | 21 | ## | 5 | 34 | ## |
| Kelowna | 16 | 19 | 19 | 3 | 53 | ## | 19 | 72 | 279 |
| Kingston | 32 | 4 | -88 | 451 | 84 | -81 | 483 | 88 | -82 |
| Kitchener – Cambridge – Waterloo | 27 | 37 | 37 | 636 | 526 | -17 | 663 | 563 | -15 |
| Lethbridge | 22 | 46 | 109 | 4 | 46 | ## | 26 | 92 | 254 |
| London | 50 | 30 | -40 | 412 | 158 | -62 | 462 | 188 | -59 |
| Moncton | 17 | 27 | 59 | 271 | 107 | -61 | 288 | 134 | -53 |
| Montréal | 52 | 92 | 77 | 988 | 2,223 | 125 | 1,040 | 2,315 | 123 |
| Nanaimo | 6 | 9 | 50 | 54 | 4 | -93 | 60 | 13 | -78 |
| Oshawa | 18 | 35 | 94 | 4 | 23 | 475 | 22 | 58 | 164 |
| Ottawa – Gatineau | 192 | 141 | -27 | 623 | 1,826 | 193 | 815 | 1,967 | 141 |
| Gatineau | 36 | 2 | -94 | 182 | 98 | -46 | 218 | 100 | -54 |
| Ottawa | 156 | 139 | -11 | 441 | 1,728 | 292 | 597 | 1,867 | 213 |
| Peterborough | 5 | 8 | 60 | 0 | 0 | - | 5 | 8 | 60 |
| Québec | 12 | 18 | 50 | 145 | 129 | -11 | 157 | 147 | -6 |
| Red Deer | 7 | 11 | 57 | 5 | 20 | 300 | 12 | 31 | 158 |
| Regina | 18 | 31 | 72 | 82 | 14 | -83 | 100 | 45 | -55 |
| Saguenay | 45 | 21 | -53 | 102 | 131 | 28 | 147 | 152 | 3 |
| St. Catharines – Niagara | 25 | 59 | 136 | 24 | 575 | ## | 49 | 634 | ## |
| Saint John | 15 | 28 | 87 | 47 | 43 | -9 | 62 | 71 | 15 |
| St. John's | 42 | 55 | 31 | 29 | 25 | -14 | 71 | 80 | 13 |
| Saskatoon | 90 | 135 | 50 | 72 | 241 | 235 | 162 | 376 | 132 |
| Sherbrooke | 28 | 15 | -46 | 111 | 195 | 76 | 139 | 210 | 51 |
| Thunder Bay | 11 | 3 | -73 | 0 | 0 | - | 11 | 3 | -73 |
| Toronto | 328 | 171 | -48 | 652 | 2,291 | 251 | 980 | 2,462 | 151 |
| Trois-Rivières | 7 | 7 | - | 128 | 51 | -60 | 135 | 58 | -57 |
| Vancouver | 156 | 159 | 2 | 2,234 | 2,642 | 18 | 2,390 | 2,801 | 17 |
| Victoria | 36 | 45 | 25 | 481 | 418 | -13 | 517 | 463 | -10 |
| Windsor | 43 | 24 | -44 | 57 | 79 | 39 | 100 | 103 | 3 |
| Winnipeg | 109 | 126 | 16 | 162 | 67 | -59 | 271 | 193 | -29 |
| Total | 2,746 | 2,323 | -15 | 11,422 | 16,170 | 42 | 14,168 | 18,493 | 31 |
Data for 2022 based on 2016 Census Definitions and data for 2023, 2024 and 2025 based on 2021 Census Definitions.
Source: CMHC Starts and Completion Survey, Market Absorption Survey
## not calculable / extreme value
