


 Share via Email
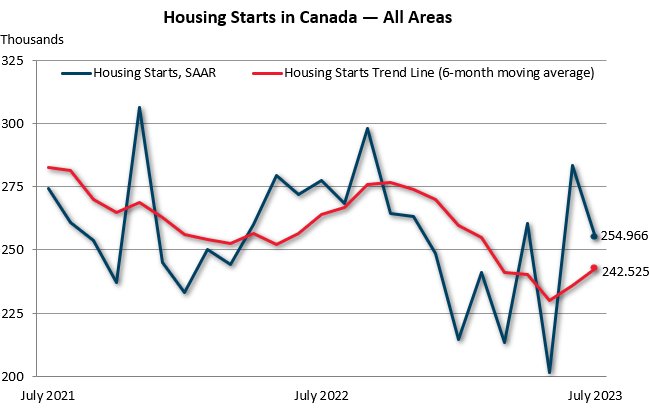
The housing starts trendline increased for the second consecutive month due to a healthy number of actual housing starts in July. The trend was 242,525 units, up 2.8% from 235,819 units in June, according to Canada Mortgage and Housing Corporation (CMHC). The trend measure is a six-month moving average of the monthly SAAR of total housing starts for all areas in Canada.
The standalone monthly seasonally adjusted annual rate (SAAR) of total housing starts for all areas in Canada decreased 10% in July (254,966 units) compared to June (283,498 units), which was the strongest month so far this year. Despite the monthly drop, total SAAR housing starts for all areas in Canada was 7.4% above the 5-year average.
The monthly SAAR of total urban starts (centres 10,000 population and over) decreased by 11%, with 234,857 units recorded in July. Multi-unit urban starts decreased 12% to 193,446 units, while single-detached urban starts decreased 4% to 41,411 units.
The Vancouver and Toronto CMAs saw decreases in total SAAR housing starts in July, with Vancouver down 23%, and Toronto down 29%. In contrast, the Montreal, Calgary, and Edmonton CMAs recorded respective increases of 12%, 33%, and 67% in total SAAR housing starts.
The rural starts monthly SAAR estimate was 20,109 units.
Quote:
“Despite a decrease in the SAAR of housing starts relative to last month, July saw a healthy number of actual housings starts from a historical perspective. This pushed the trend of housing starts upward for the second consecutive month. Market intelligence suggests multi-unit projects started in June and July were likely financed a few months prior, so, the effect of the most recent interest rate hikes on housing starts remains to be seen,” said Bob Dugan, CMHC's Chief Economist.
Key facts:
- Toronto and Vancouver have been performing well this year compared to last. Actual 2023 year-to-date housing starts were 35% and 49% higher than the same period in 2022 in Toronto and Vancouver respectively.
- Monthly Housing Starts and Other Construction Data are accessible in English and French on our website and the CMHC Housing Market Information Portal.
- Housing starts data is available on the eleventh business day each month. We will release the August housing starts data on September 18 at 8:15 AM ET.
- CMHC uses the trend measure as a complement to the monthly SAAR of housing starts to account for considerable swings in monthly estimates and obtain a clearer picture of upcoming new housing supply. In some situations, analyzing only SAAR data can be misleading, as the multi-unit segment largely drives the market and can vary significantly from one month to the next.
- Definitions and methodology to better understand the foundations of the Starts and Completions and Market Absorption surveys.
As a trusted source of housing information, CMHC provides unbiased housing-related data, research, and market information to help close knowledge gaps, and deepen understanding of complex housing issues to inform future policy decisions. Housing starts facilitate the analysis of monthly, quarterly, and year-over-year activity in the new home market. The data we collect as part of our Starts and Completions and Market Absorption surveys helps us obtain a clearer picture of upcoming new housing supply and is used as part of our various housing reports.
For more information, follow us on Twitter, YouTube, LinkedIn, Facebook and Instagram.
Additional information:
- Spring 2023 Housing Market Outlook (PDF)
- Latest Housing Supply Report (HSR)
- Housing Supply Report (HSR) — Fall Edition
- The road ahead for the economy and housing — fall 2022 update
- Canada’s housing supply shortage: skilled labour capacity
- Understanding Canada's housing supply shortages
For information on this release:
To request an interview with a CMHC market analyst, contact:
Media Relations, CMHC
media@cmhc-schl.gc.ca
| Single-Detached | All Others | Total | |||||||
|---|---|---|---|---|---|---|---|---|---|
| July 2022 | July 2023 | % | July 2022 | July 2023 | % | July 2022 | July 2023 | % | |
| N.-L. | 78 | 42 | -46 | 7 | 16 | 129 | 85 | 58 | -32 |
| P.E.I. | 27 | 21 | -22 | 16 | 51 | 219 | 43 | 72 | 67 |
| N.S. | 216 | 181 | -16 | 545 | 266 | -51 | 761 | 447 | -41 |
| N.B. | 131 | 104 | -21 | 356 | 306 | -14 | 487 | 410 | -16 |
| Atlantic | 452 | 348 | -23 | 924 | 639 | -31 | 1,376 | 987 | -28 |
| Qc | 663 | 471 | -29 | 3,720 | 2,313 | -38 | 4,383 | 2,784 | -36 |
| Ont. | 2,198 | 1,482 | -33 | 6,047 | 6,865 | 14 | 8,245 | 8,347 | 1 |
| Man. | 273 | 136 | -50 | 330 | 644 | 95 | 603 | 780 | 29 |
| Sask. | 141 | 86 | -39 | 133 | 327 | 146 | 274 | 413 | 51 |
| Alta. | 1,356 | 1,122 | -17 | 2,204 | 2,168 | -2 | 3,560 | 3,290 | -8 |
| Prairies | 1,770 | 1,344 | -24 | 2,667 | 3,139 | 18 | 4,437 | 4,483 | 1 |
| B.C. | 672 | 428 | -36 | 3,126 | 3,574 | 14 | 3,798 | 4,002 | 5 |
| Canada (10,000+) | 5,755 | 4,073 | -29 | 16,484 | 16,530 | 0 | 22,239 | 20,603 | -7 |
Data for 2022 based on 2016 Census Definitions and data for 2023 based on 2021 Census Definitions.
Source: CMHC
## not calculable / extreme value
| Single-Detached | All Others | Total | |||||||
|---|---|---|---|---|---|---|---|---|---|
| July 2022 | July 2023 | % | July 2022 | July 2023 | % | July 2022 | July 2023 | % | |
| Abbotsford – Mission | 26 | 16 | -38 | 130 | 14 | -89 | 156 | 30 | -81 |
| Barrie | 188 | 55 | -71 | 141 | 61 | -57 | 329 | 116 | -65 |
| Belleville – Quinte West | 20 | 45 | 125 | 5 | 4 | -20 | 25 | 49 | 96 |
| Brantford | 71 | 24 | -66 | 110 | 41 | -63 | 181 | 65 | -64 |
| Calgary | 523 | 542 | 4 | 1,356 | 1,079 | -20 | 1,879 | 1,621 | -14 |
| Chilliwack | 17 | 12 | -29 | 2 | 7 | 250 | 19 | 19 | - |
| Drummondville | 29 | 21 | -28 | 4 | 33 | ## | 33 | 54 | 64 |
| Edmonton | 625 | 443 | -29 | 752 | 1,029 | 37 | 1,377 | 1,472 | 7 |
| Fredericton | 32 | 41 | 28 | 142 | 186 | 31 | 174 | 227 | 30 |
| Greater / Grand Sudbury | 8 | 35 | 338 | 22 | 87 | 295 | 30 | 122 | 307 |
| Guelph | 12 | 8 | -33 | 17 | 185 | ## | 29 | 193 | ## |
| Halifax | 78 | 76 | -3 | 417 | 209 | -50 | 495 | 285 | -42 |
| Hamilton | 92 | 27 | -71 | 103 | 33 | -68 | 195 | 60 | -69 |
| Kamloops | 16 | 0 | -100 | 10 | 0 | -100 | 26 | 0 | -100 |
| Kelowna | 52 | 32 | -38 | 40 | 56 | 40 | 92 | 88 | -4 |
| Kingston | 49 | 35 | -29 | 22 | 368 | ## | 71 | 403 | 468 |
| Kitchener – Cambridge – Waterloo | 93 | 60 | -35 | 305 | 223 | -27 | 398 | 283 | -29 |
| Lethbridge | 30 | 27 | -10 | 9 | 3 | -67 | 39 | 30 | -23 |
| London | 102 | 82 | -20 | 204 | 60 | -71 | 306 | 142 | -54 |
| Moncton | 49 | 30 | -39 | 185 | 97 | -48 | 234 | 127 | -46 |
| Montréal | 165 | 118 | -28 | 1,944 | 854 | -56 | 2,109 | 972 | -54 |
| Nanaimo | 15 | 6 | -60 | 90 | 9 | -90 | 105 | 15 | -86 |
| Oshawa | 103 | 97 | -6 | 234 | 67 | -71 | 337 | 164 | -51 |
| Ottawa – Gatineau | 306 | 137 | -55 | 1,824 | 779 | -57 | 2,130 | 916 | -57 |
| Gatineau | 70 | 47 | -33 | 276 | 85 | -69 | 346 | 132 | -62 |
| Ottawa | 236 | 90 | -62 | 1,548 | 694 | -55 | 1,784 | 784 | -56 |
| Peterborough | 41 | 10 | -76 | 0 | 0 | - | 41 | 10 | -76 |
| Québec | 102 | 59 | -42 | 521 | 334 | -36 | 623 | 393 | -37 |
| Red Deer | 9 | 4 | -56 | 2 | 6 | 200 | 11 | 10 | -9 |
| Regina | 39 | 25 | -36 | 44 | 10 | -77 | 83 | 35 | -58 |
| Saguenay | 36 | 17 | -53 | 12 | 246 | ## | 48 | 263 | 448 |
| St. Catharines – Niagara | 130 | 46 | -65 | 26 | 101 | 288 | 156 | 147 | -6 |
| Saint John | 28 | 17 | -39 | 5 | 4 | -20 | 33 | 21 | -36 |
| St. John's | 68 | 34 | -50 | 3 | 13 | 333 | 71 | 47 | -34 |
| Saskatoon | 95 | 54 | -43 | 77 | 308 | 300 | 172 | 362 | 110 |
| Sherbrooke | 42 | 22 | -48 | 70 | 223 | 219 | 112 | 245 | 119 |
| Thunder Bay | 23 | 8 | -65 | 19 | 0 | -100 | 42 | 8 | -81 |
| Toronto | 533 | 472 | -11 | 2,882 | 4,728 | 64 | 3,415 | 5,200 | 52 |
| Trois-Rivières | 17 | 26 | 53 | 66 | 129 | 95 | 83 | 155 | 87 |
| Vancouver | 276 | 211 | -24 | 1,700 | 2,751 | 62 | 1,976 | 2,962 | 50 |
| Victoria | 107 | 31 | -71 | 861 | 428 | -50 | 968 | 459 | -53 |
| Windsor | 68 | 27 | -60 | 90 | 23 | -74 | 158 | 50 | -68 |
| Winnipeg | 228 | 111 | -51 | 243 | 621 | 156 | 471 | 732 | 55 |
| Total | 4,543 | 3,143 | -31 | 14,689 | 15,409 | 5 | 19,232 | 18,552 | -4 |
Data for 2022 based on 2016 Census Definitions and data for 2023 based on 2021 Census Definitions.
Source: CMHC
## not calculable / extreme value
| Single-Detached | All Others | Total | |||||||
|---|---|---|---|---|---|---|---|---|---|
| June 2023 | July 2023 | % | June 2023 | July 2023 | % | June 2023 | July 2023 | % | |
| N.L. | 422 | 385 | -9 | 53 | 122 | 130 | 475 | 507 | 7 |
| P.E.I. | 142 | 169 | 19 | 120 | 612 | 410 | 262 | 781 | 198 |
| N.S. | 2,175 | 1,786 | -18 | 11,134 | 3,168 | -72 | 13,309 | 4,954 | -63 |
| N.B. | 1,004 | 809 | -19 | 2,966 | 3,654 | 23 | 3,970 | 4,463 | 12 |
| Qc | 3,559 | 4,726 | 33 | 21,992 | 25,276 | 15 | 25,551 | 30,002 | 17 |
| Ont. | 15,429 | 14,525 | -6 | 101,423 | 80,244 | -21 | 116,852 | 94,769 | -19 |
| Man. | 1,548 | 1,328 | -14 | 5,208 | 7,728 | 48 | 6,756 | 9,056 | 34 |
| Sask. | 934 | 871 | -7 | 5,796 | 3,924 | -32 | 6,730 | 4,795 | -29 |
| Alta. | 11,376 | 12,052 | 6 | 14,585 | 25,748 | 77 | 25,961 | 37,800 | 46 |
| B.C. | 6,368 | 4,760 | -25 | 57,175 | 42,970 | -25 | 63,543 | 47,730 | -25 |
| Canada (10,000+) | 42,957 | 41,411 | -4 | 220,452 | 193,446 | -12 | 263,409 | 234,857 | -11 |
| Canada (All Areas) | 57,317 | 55,093 | -4 | 226,179 | 199,873 | -12 | 283,498 | 254,966 | -10 |
Data for 2022 based on 2016 Census Definitions and data for 2023 based on 2021 Census Definitions.
Source: CMHC
## not calculable / extreme value
| Single-Detached | All Others | Total | |||||||
|---|---|---|---|---|---|---|---|---|---|
| June 2023 | July 2023 | % | June 2023 | July 2023 | % | June 2023 | July 2023 | % | |
| Abbotsford – Mission | 204 | 245 | 20 | 636 | 168 | -74 | 840 | 413 | -51 |
| Barrie | 1,197 | 449 | -62 | 4,356 | 732 | -83 | 5,553 | 1,181 | -79 |
| Belleville – Quinte West | 203 | 377 | 86 | 384 | 48 | -88 | 587 | 425 | -28 |
| Brantford | 1,202 | 348 | -71 | 24 | 492 | ## | 1,226 | 840 | -31 |
| Calgary | 5,693 | 6,112 | 7 | 8,652 | 12,948 | 50 | 14,345 | 19,060 | 33 |
| Chilliwack | 278 | 155 | -44 | 278 | 84 | -70 | 446 | 239 | -46 |
| Drummondville | 131 | 232 | 77 | 324 | 396 | 22 | 455 | 628 | 38 |
| Edmonton | 4,703 | 4,704 | 0 | 5,484 | 12,348 | 125 | 10,187 | 17,052 | 67 |
| Fredericton | 390 | 326 | -16 | 972 | 2,232 | 130 | 1,362 | 2,558 | 88 |
| Greater / Grand Sudbury | 22 | 253 | ## | 24 | 1,044 | ## | 46 | 1,297 | ## |
| Guelph | 45 | 77 | 71 | 1,632 | 2,220 | 36 | 1,677 | 2,297 | 37 |
| Halifax | 722 | 726 | 1 | 10,644 | 2,508 | -76 | 11,366 | 3,234 | -72 |
| Hamilton | 315 | 283 | -10 | 3,456 | 396 | -89 | 3,771 | 679 | -82 |
| Kamloops | 59 | 0 | -100 | 12 | 0 | -100 | 71 | 0 | -100 |
| Kelowna | 519 | 389 | -25 | 3,864 | 672 | -83 | 4,383 | 1,061 | -76 |
| Kingston | 239 | 290 | 21 | 0 | 4,416 | ## | 239 | 4,706 | ## |
| Kitchener – Cambridge – Waterloo | 1,122 | 747 | -33 | 648 | 2,676 | 313 | 1,770 | 3,423 | 93 |
| Lethbridge | 227 | 206 | -9 | 24 | 36 | 50 | 251 | 242 | -4 |
| London | 345 | 756 | 119 | 2,568 | 720 | -72 | 2,913 | 1,476 | -49 |
| Moncton | 263 | 193 | -27 | 1,968 | 1,164 | -41 | 2,231 | 1,357 | -39 |
| Montréal | 1,057 | 1,224 | 16 | 9,068 | 10,092 | 11 | 10,125 | 11,316 | 12 |
| Nanaimo | 166 | 87 | -48 | 36 | 108 | 200 | 202 | 195 | -3 |
| Oshawa | 1,010 | 994 | -2 | 720 | 804 | 12 | 1,730 | 1,798 | 4 |
| Ottawa – Gatineau | 2,655 | 1,271 | -52 | 9,504 | 9,348 | -2 | 12,159 | 10,619 | -13 |
| Gatineau | 331 | 372 | 12 | 4,956 | 1,020 | -79 | 5,287 | 1,392 | -74 |
| Ottawa | 2,324 | 899 | -61 | 4,548 | 8,328 | 83 | 6,872 | 9,227 | 34 |
| Peterborough | 35 | 63 | 80 | 0 | 0 | - | 35 | 63 | 80 |
| Québec | 352 | 493 | 40 | 6,480 | 4,008 | -38 | 6,832 | 4,501 | -34 |
| Red Deer | 39 | 37 | -5 | 48 | 72 | 50 | 87 | 109 | 25 |
| Regina | 101 | 214 | 112 | 1,788 | 120 | -93 | 1,889 | 334 | -82 |
| Saguenay | 202 | 152 | -25 | 168 | 2,952 | ## | 370 | 3,104 | ## |
| St. Catharines – Niagara | 428 | 415 | -3 | 1,584 | 1,212 | -23 | 2,012 | 1,627 | -19 |
| Saint John | 247 | 161 | -35 | 0 | 48 | ## | 247 | 209 | -15 |
| St. John's | 363 | 337 | -7 | 60 | 156 | 160 | 423 | 493 | 17 |
| Saskatoon | 757 | 545 | -28 | 3,996 | 3,696 | -8 | 4,753 | 4,241 | -11 |
| Sherbrooke | 193 | 198 | 3 | 852 | 2,676 | 214 | 1,045 | 2,874 | 175 |
| Thunder Bay | 97 | 51 | -47 | 48 | 0 | -100 | 145 | 51 | -65 |
| Toronto | 4,253 | 4,330 | 2 | 81,612 | 56,736 | -30 | 85,865 | 61,066 | -29 |
| Trois-Rivières | 65 | 313 | 382 | 3,204 | 1,548 | -52 | 3,269 | 1,861 | -43 |
| Vancouver | 3,622 | 2,426 | -33 | 42,660 | 33,012 | -23 | 46,282 | 35,438 | -23 |
| Victoria | 249 | 273 | 10 | 5,724 | 5,136 | -10 | 5,973 | 5,409 | -9 |
| Windsor | 236 | 241 | 2 | 300 | 276 | -8 | 536 | 517 | -4 |
| Winnipeg | 1,386 | 1,111 | -20 | 5,136 | 7,452 | 45 | 6,522 | 8,563 | 31 |
Data for 2022 based on 2016 Census Definitions and data for 2023 based on 2021 Census Definitions.
Source: CMHC
## not calculable / extreme value
