
 FR
FR
 Sign In



 Done!
Done!





 Link copied
 Share via Email
The complete set of results from the Survey of Social and Affordable Housing — Rental Structures are in. These results replace the data presented in the tables from the December 18, 2019 release.
Findings are available at the national, provincial, territorial, and centre levels for the following variables:
- number of units
- units by type of administrative body
- units by year of construction
- vacancy rates
- average rents
- mechanisms used to determine rents
You will also find units by year of construction cross-referenced with the state of building condition.
Results are also available for provinces and territories for:
- units per type of clientele versus administrative body
- number of structures by type of repairs
- accessibility features
Here is an overview of the full findings.
Where we collected the social and affordable housing data:
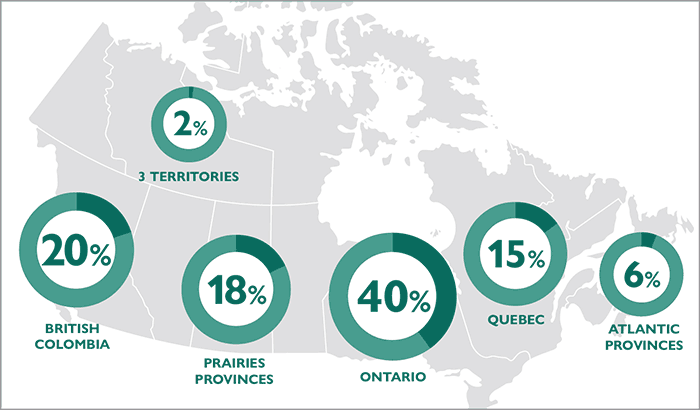
The survey covered slightly more than 468,000 units located in:
- The three Territories: 2%
- British Columbia: 20%
- Prairie Provinces:18%
- Ontario: 40%
- Quebec: 15%
- Atlantic Provinces: 6%
What type of organizations accounted for the units in the survey?
- 54% different levels of government bodies
- 26% were non-profit organizations
- 17% were cooperatives
- 3% were private companies or partnerships between the aforementioned groups
How old were the units?
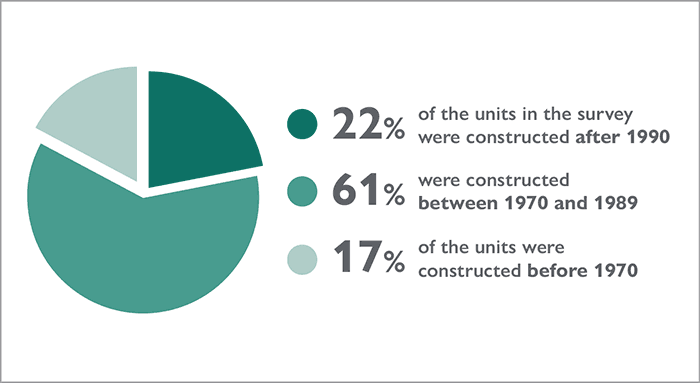
- 22% of the units in the survey were constructed after 1990
- 61% were constructed between 1970 and 1989
- 17% of the units were constructed before 1970
In 9 out of 10 provinces, 75% or more of the units were built before 1990. The only exception was British Columbia at 66%. The breakdown between pre and post 1990 periods of construction was nearly even for the three territories.
Unoccupied and vacant units
Respondents provided data on the number of unoccupied units in their portfolio along with the reasons why a unit was unoccupied:
- units were unoccupied and available to rent but no lease was signed yet
- units were unoccupied and available for occupancy but not yet available to rent
- units were unoccupied because major repairs were needed
- units were unoccupied because they were being renovated or retrofitted
The vacancy rate is defined as units that were unoccupied and available to rent but no lease was signed yet. This rate was 1.6% nationally. At the provincial and territorial level, the vacancy rate varied. It ranged from 0.2% in Nunavut, 0.3% in P.E.I, 0.6% in Ontario to 15.1% in Saskatchewan.
A key reason for Saskatchewan’s elevated vacancy rate is due to a significant share of units being located in rural centres. Declining populations in rural areas have reduced the demand for these units.
The unoccupied rate is calculated by dividing all unoccupied units by total units. This rate was 3% nationally. It ranged from 0.3% in Nunavut and 0.4% in P.E.I. to 5.1% in Alberta and 18.7% in Saskatchewan.
What was the average rent?
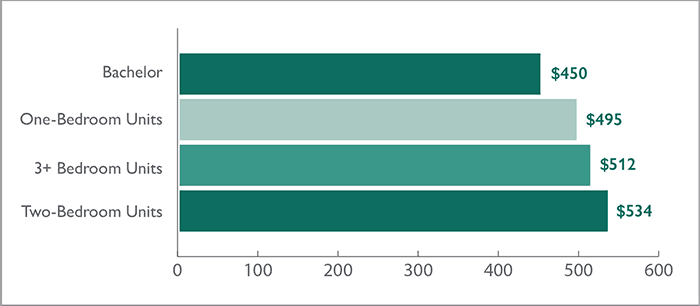
The survey also gathered information on rents according to number of bedrooms.
The average monthly rents nationally were $450 and $495 respectively for bachelor and one-bedroom units. The average rent nationally for 3+ bedroom units was $512. The average national monthly rent for two-bedroom units was $534.
How were rents determined?
- At 70%, household income was the most common mechanism used to set rents.
- In 25% of instances, the main determinant of rents was operating costs or market rents.
About the Survey of Social and Affordable Housing — Rental Structures
In November 2018, we launched the survey and spent a year collecting data. The survey gathers information on the characteristics of Canada’s social and affordable housing stock.
We asked questions that covered topics about the number of units per centre, number of units by bedroom type per centre, rent amounts, resident type and accessibility features. Respondents included providers of social and affordable housing, including different levels of government, non-profit organizations, cooperatives, and private companies.
There are several revisions of the earlier release because of additional data clean-up. This resulted in further reweighting for non-response to make sure that findings more accurately reflect the number of units by administrative body and the responses associated with these units.
The Survey of Social and Affordable Housing — Rental Structures is a result of the Housing Needs Data Initiative under the National Housing Strategy. Its goal is to develop data and indicators to understand progress towards improved housing outcomes for everyone in Canada.