Professionals Consumers Housing Observer About
Skip to content
CMHC Home Canada Mortgage
and Housing Corporation
  • FR
  • Sign in photo Sign In
  • Professionals
  • Consumers
  • Housing Observer
  • About
FR
  • The Housing Observer
  • New home purchases are the main driver of mortgage debt
  • Save
  • Share

New home purchases are the main driver of mortgage debt

January 25, 2022

Save Icon

SAVE TO MY FOLDER

New home purchases are the main driver of mortgage debt

SAVE
Close this Window   |   Manage my Folder
Save Icon

SAVE TO MY FOLDER

New home purchases are the main driver of mortgage debt

Done Done!
Close this Window   |   Manage my Folder
Share icon

Share via

  • Facebook
  • LinkedIn
  • Mail
  • print
  • CopyLink

SuccessCopyLinkVersionLink copied

Share icon

Share via

  • Facebook
  • LinkedIn
  • Mail
  • print
  • CopyLink

SuccessCopyLinkVersionLink copied

share icon

Mail-blue Share via Email

Did You Know?

You can include an email signature?

Register | Sign In

×
Google Captcha Loader
share icon

Mail-blue Share via Email

Done Done!
Close this window

What you need to know about mortgage growth, mortgage arrears and alternative lenders in the third quarter of 2021. Get all the details in our winter 2022 Residential Mortgage Industry Report Dashboard.

Mortgage growth continued to increase

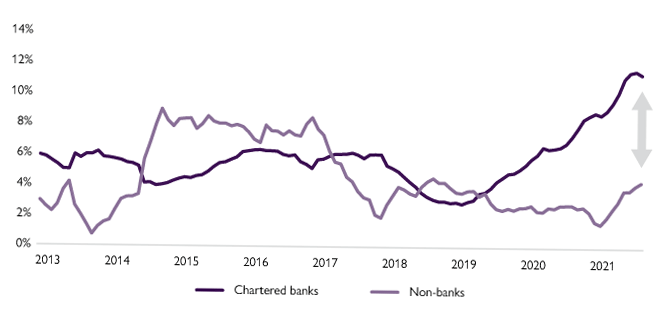
Mortgage growth continued to increase in the third quarter of 2021. It went up 10%, bringing total residential mortgage debt in Canada to $1.77 trillion. Since the beginning of the pandemic, chartered banks (+11%) continue to heavily outpace non-banks (+4%) in terms of year-over-year growth of their mortgage portfolio.

Figure 1: Mortgage growth by chartered banks largely outpaces non-banks' new mortgage activity

Sources: Statistics Canada. Table: 36-10-0639-01 Credit liabilities of households, Bank of Canada; CMHC calculations.

Text Version

Figure 1: Mortgage growth by chartered banks largely outpaces non-banks' new mortgage activity
  Chartered banks  Non-banks 
2013 6% 3%
2014 6% 2%
2015 4% 8%
2016 6% 7%
2017 6% 8%
2018 5% 3%
2019 3% 4%
2020 5% 3%
2021 9% 2%

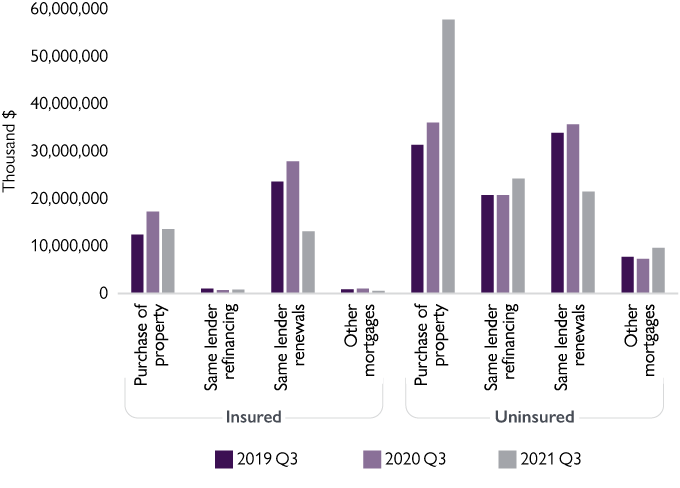
Purchase of new property is the main driver of mortgage debt for chartered banks, especially in the uninsured space. In the third quarter of 2021, close to $58 billion worth of residential mortgages were extended. This is an increase of 60% compared to the same period in 2020 and almost double what was extended in the same period of 2019.

Refinancing also contributed to the increase in mortgage debt, (+16%) year-over-year. This is due to mortgage borrowers capitalizing on the low interest rate environment and added equity due to house price increase.

Figure 2: Uninsured purchases of property drive mortgage growth

Source: CMHC residential mortgage data reporting of NHA MBS issuers; CMHC calculations.

Text Version

Figure 2: Uninsured purchases of property drive mortgage growth in the third quarter of 2021, chartered banks
2019 Q3 2020 Q3 2021 Q3
Purchase of property 12,448,810 17,303,354 13,601,447
Same lender refinancing 1,091,634 717,907 863,923
Same lender renewals 23,600,521 27,903,232 13,120,822
Other mortgages 930,411 1,070,632 554,481
Purchase of property 31,372,663 36,089,126 57,792,538
Same lender refinancing 20,771,061 20,751,681 24,268,137
Same lender renewals 33,947,496 35,714,775 21,550,273
Other  mortgages 7,773,697 7,304,802 9,604,913

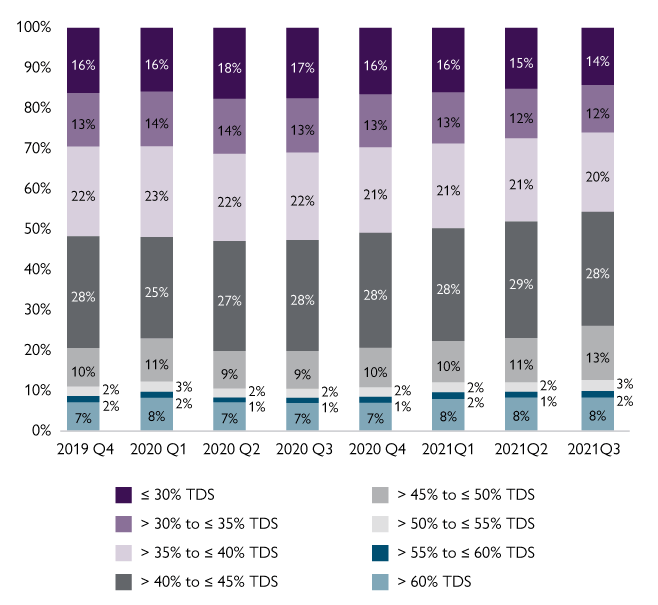
A larger share of uninsured mortgages was originated with higher total debt service ratios. Among these mortgages, more than a quarter of uninsured mortgages had a ratio over 40% compared to 6% of insured mortgages.

Moreover, the share of uninsured new mortgages with a ratio of 40% or less was on a downtrend since the second half of 2020. This decreased further in 2021, resulting in more leveraged borrowers.

Figure 3: Share of new uninsured mortgages based on total debt service ratios

Source: CMHC residential mortgage data reporting of NHA MBS issuers; CMHC calculations.

Text Version

Figure 3: Share of uninsured new mortgages with a TDS ratio of 40% or less continues to shrink at chartered banks
> 60% Uninsured > 55% to ≤ 60% Uninsured > 50% to ≤ 55% Uninsured > 45% to ≤ 50% Uninsured > 40% to ≤ 45% Uninsured > 35% to ≤ 40% Uninsured > 30% to ≤ 35% Uninsured ≤ 30% Uninsured
2021 Q3 8% 2% 3% 13% 28% 20% 12% 14%
2021 Q2 8% 1% 2% 11% 29% 21% 12% 15%
2021 Q1 8% 2% 2% 10% 28% 21% 13% 16%
2020 Q4 7% 1% 2% 10% 28% 21% 13% 16%
2020 Q3 7% 1% 2% 9% 28% 22% 13% 17%
2020 Q2 7% 1% 2% 9% 27% 22% 14% 18%
2020 Q1 8% 2% 3% 11% 25% 23% 14% 16%
2019 Q4 7% 2% 2% 10% 28% 22% 13% 16%

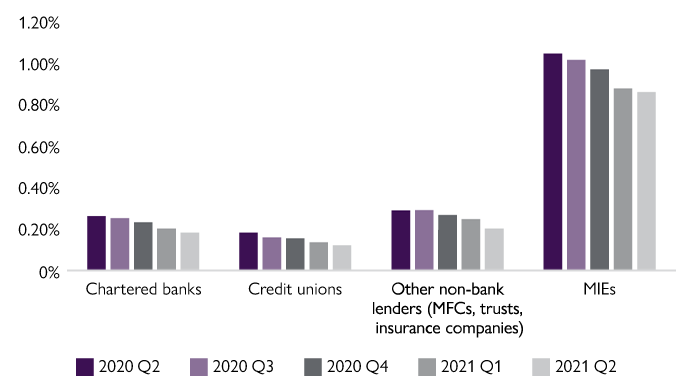
Mortgages in arrears continued to drop in the first half of 2021 for all mortgage lenders:

  • 0.18% for chartered banks
  • 0.12% for credit unions
  • 0.86% for mortgage investment entities

Factors contributing to the ability of Canadians to make the mortgage monthly payments on time included:

  • High housing prices coupled with liquid housing markets, making it easier to sell the property rapidly.
  • Greater consumer savings and the growth in disposable income.

Figure 4: Mortgages in arrears continued downward trend across all lender types

Sources: Statistics Canada's Survey of Non-Bank Mortgage Lenders, second quarter of 2021, and Canadian Bankers Association (August 2021).

Text Version

Figure 4: Mortgages in arrears (delinquent for 90 days or more) continued downward trend across all lender types
Chartered banks Credit unions Other non-bank lenders (MFCs, trusts, insurance companies) MIEs
2020 Q2 0.26% 0.18% 0.29% 1.05%
2020 Q3 0.25% 0.16% 0.29% 1.02%
2020 Q4 0.23% 0.15% 0.27% 0.97%
2021 Q1 0.20% 0.13% 0.25% 0.88%
2021 Q2 0.18% 0.12% 0.20% 0.86%

Alternative lenders slightly picked up mortgage lending activity in the second quarter of 2021. This comes after a significant slowdown in the first year of the pandemic, as uncertainty rose and investors increasingly requested redemptions. This recent growth was likely stimulated by:

  • higher demand in the context of rising housing prices
  • relatively low interest rates
  • slight regulatory changes

During the second quarter of 2021, the higher share of first mortgages and lower loan-to-value on newly originated mortgages decreased the risk of their portfolio. In addition, geographical distribution slightly shifted as Québec’s share increased from 3.7% to 5.3%.

Insights into mortgage investment corporations indicate a decrease in their risk profile
Q2 2020 Q3 2020 Q4 2020 Q1 2021 Q2 2021
Average lending rate for single-family 9.3% 9.2% 8.9% 8.9% 8.8%
Average lending rate for multi-family 8.3% 8.3% 8.2% 8.2% 8.2%
Average share of first mortgages 75.7% 76.8% 78.4% 81.3% 81.4%
Average loan-to-value (LTV) ratio 56.7% 55.9% 58.0% 58.6% 57.9%
Debt to capital 14.4% 15.6% 17.9% 17.4% 16.8%
Delinquencies of 60 days or more 4.0% 4.1% 3.55% 2.53% 2.13%
Foreclosures 3.8% 3.8% 3.88% 3.18% 2.60%
Insights into mortgage investment corporations indicate a decrease in their risk profile
(Geographical distribution)
Geographical distribution Q2 2020 Q3 2020 Q4 2020 Q1 2021 Q2 2021
British Columbia 36.2% 37.6% 36.5% 36.4% 36.0%
Alberta 8.3% 7.1% 7.6% 8.1% 8.1%
Ontario 48.3% 47.8% 47.7% 48.7% 49.2%
Quebec 2.1% 2.9% 3.7% 3.8% 5.3%
Others 4.6% 4.2% 4.2% 3.0% 1.4%

Sources: Mortgage Investment Corporations (MIC) Survey, Fundamentals Research Corp, second quarter of 2021

Download the dashboard (PDF)

Explore related data in the Residential Mortgage Industry Data Dashboard, a digital interactive companion to the Residential Mortgage Industry Report.

Get new analyses and reports as soon as they are released, sign up to receive our Housing Research Newsletter.

Related links

  • Housing Market Outlook
  • Housing Market Assessment

Was this page relevant to your needs?

Thank you for your feedback!

How Can We Help?

What could we improve?

Please select all that apply.
Note: You will not receive a reply. Don't include personal information.

Google Captcha Loader

How Can We Help?

Report a Bug

Please describe the problem.

Google Captcha Loader

Thank you. Your feedback has been submitted.

Discover related content using the tags below:

  • Mortgage Loan Insurance
  • Mortgage Insights
  • Financing
  • Housing Market
  • Research
Date Published: January 25, 2022

By Topic

  • Professionals
    • Project funding and mortgage financing
    • Housing markets data and research
    • Industry innovation and leadership
    • Events and speakers
  • Consumers
    • Home buying
    • Owning a home
    • Renting a home

About Us

  • CMHC's Story
  • Management and Governance
  • Our Partners
  • Corporate Reporting
  • Contact Us
  • Careers

More

  • CMHC Housing Updates
  • CMHC Library
  • Housing Observer
  • Media Newsroom
  • CMHC and Accessible Housing
  • CMHC on Twitter
  • CMHC on LinkedIn
  • CMHC on Facebook
  • CMHC on Instagram
  • CMHC on YouTube
Privacy Policy    |    Terms and Conditions    |    Transparency    |    Accessibility Plan    |    Accessibility Feedback     Canada Mortgage and Housing Corporation (CMHC) ©2026 
Canada
loader icon